The first read on US 2nd quarter read was strong and yet the dollar has fallen in the wake of the news. While strong at 2.6% the estimate is only as expected and comes with a downward revision to the first quarter. The revision trimmed 0.2% off the first quarter bringing the the first half annualized rate to just under the current 2.0% expectation and did little to alter FOMC outlook. Outlook for rate hikes has fallen to long term lows and is now less than 50/50 for another before the end of the year. The combination of as expected news and diminished FOMC outlook along with the recently strengthened ECB outlook has set the dollar and the Dollar Index up for weakness.
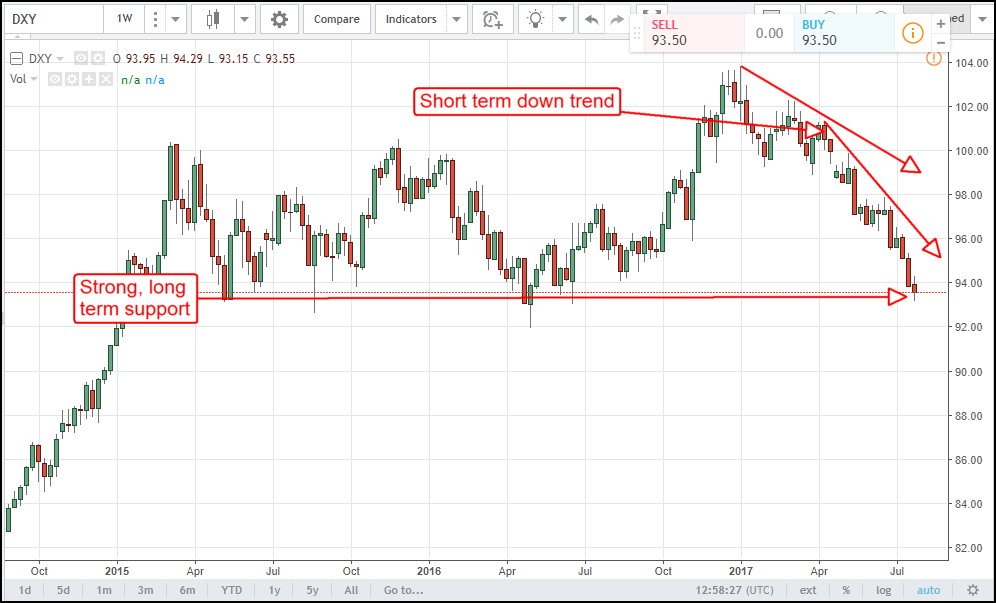
The Dollar Index is in down trend versus a basket of foreign currencies, specifically the euro, and fast approaching a 2 year low and potentially strong support. A continued rebalance of central bank outlook could provide enough downward pressure to break support and take the index to new long term lows. This rebalance is driven by the hawkish shift in the ECB which has brought them back into convergence with the FOMC and adding strength to the euro.

The risk now is twofold. On the one hand if EU data begins to weaken then ECB outlook will dim and allow the dollar to rise. On the other, if US data begins to strengthen then the FOMC outlook will strengthen and not only allow the dollar to rise but to drive it higher. Looking to other data points I am leaning toward the idea that US data will strengthen in the second half and bring rate hikes back onto the table.
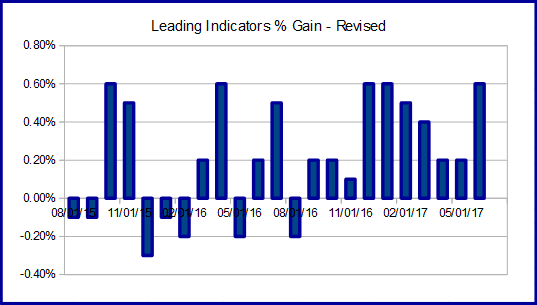
The KC Fed’s Labor Market Conditions Index has been signaling economic growth and expansion for over a year. The most recent data shows a marked uptick in activity and momentum indicative of acceleration within the economy. Backing this up is the Index of Leading Indicators. That index has been positive for 10 months and moved up to 0.6% in the last month. Economists at the Conference Board who maintain the index say it is suggestive of expanding growth toward the end of the year.
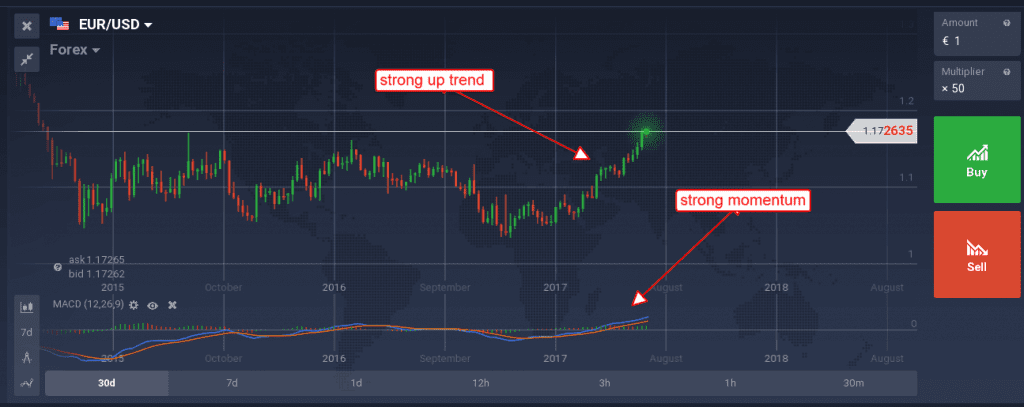
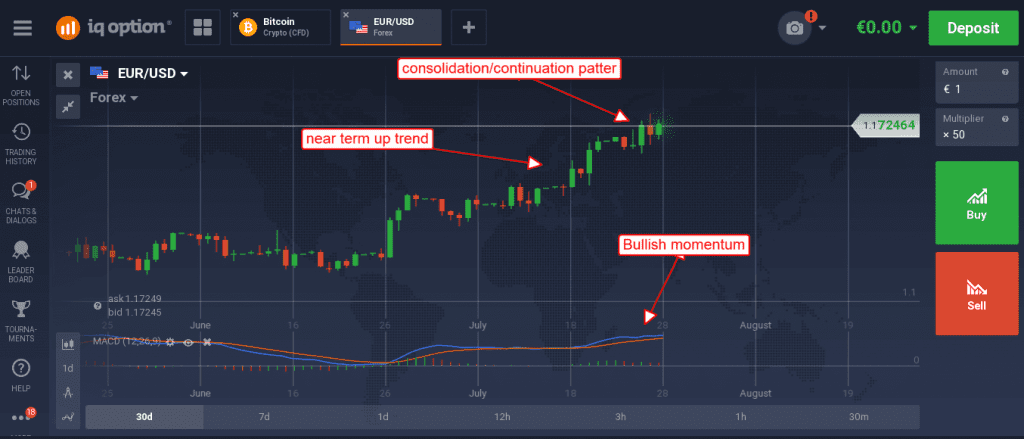
A look to the chart of the EUR/USD shows a forex pair in strong up trend. The pair is moving higher on strong momentum and likely to move higher. Recent price action has formed a small consolidation pattern that has begun to break out on today’s GDP data.

Pulling back to the weekly view we can see that this up trend is also testing long term resistance at 1.1719. This resistance is possibly strong and will likely have long ranging impact on the future direction of the asset. Near term outlook is bullish so a test and possibly break of resistance is to be expected. A close above resistance will be mildly bullish, a test and confirmation of resistance turned support will be strongly bullish with upside targets near 1.2400.


