The Envelopes indicator is a relatively simple in use trend indicator which can be applied on its own or paired with oscillators in a trading strategy. It can be used with any trading instrument and any timeframe, but it can also be applied with the standard settings for your convenience. Read the article to find out how you may use it to spot potential trading opportunities on the chart.
How does it work?
The Envelopes indicator is essentially a simplified version of Bollinger Bands. It is a combination of three Moving Averages (MA). Two of them are deviated to the up and down sides from the price which creates a channel that envelopes the price. The channel represents the normal trading range of a security, while the two MAs function as the markers of the overbought/oversold levels. The middle Moving Average follows the trend.
In simple words, the upper and lower lines act as the support and resistance levels and may allow the trader to take advantage of the price reversal on the chart. The middle line displays the direction of the current trend. An upward incline might be a sign of an upward trend, while a decline might be a sign of a downward trend. If the middle MA is not aiming towards any direction, it may be a sign of a flat market.
How can it be used in practice?
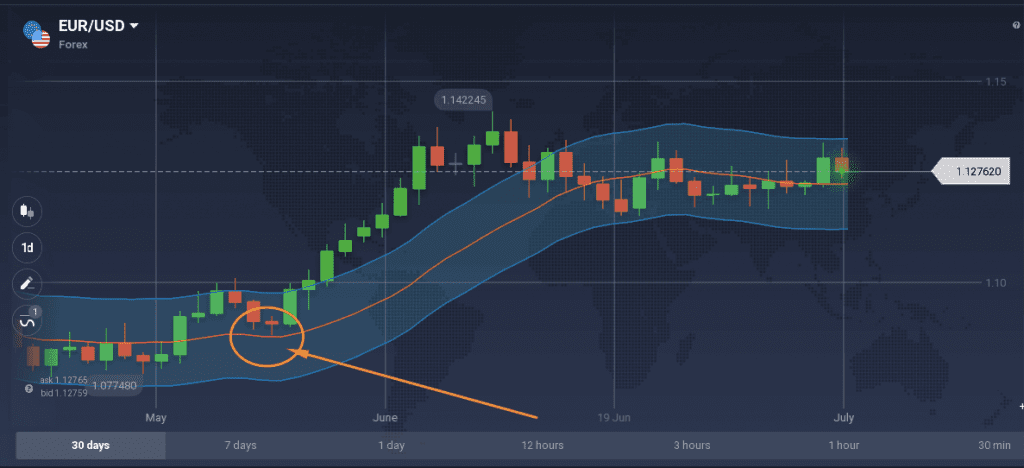
A buy signal is received when the middle MA is changing its direction upward.
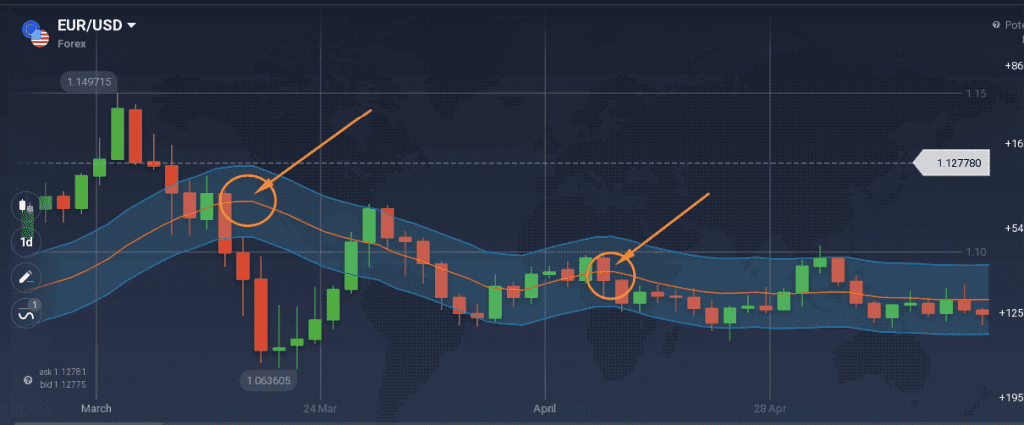
A selling signal is observed when the middle MA is changing the direction downward.
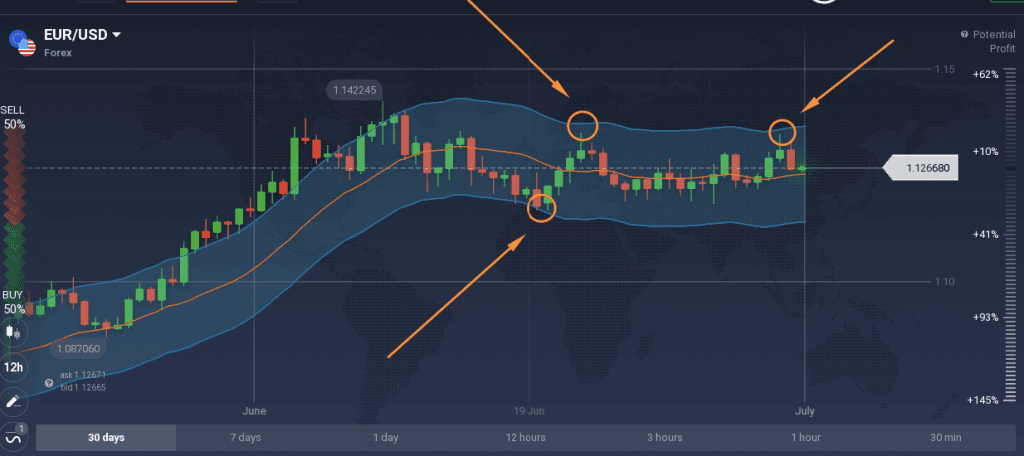
In case of a flat market, one may use the overbought and oversold levels as the reference point. Traders may use the upper and lower MAs to spot reversals and breakouts.
In the example, several reversals are spotted when the price hits the upper or lower Moving Average and bounces back without breaking through the level. When it hits the upper or lower band, it means that it hit the extreme.
As with any other indicator, a divergence may happen and the indicator might show false signals from time to time. One may combine the Envelopes indicator with oscillators like RSI, in order to potentially receive more accurate information. Stop Loss and Take Profit levels may also help the trader manage the risks involved.
How to set it up?
To set up this indicator, simply find it in the Moving Averages sections of the Indicators tab:
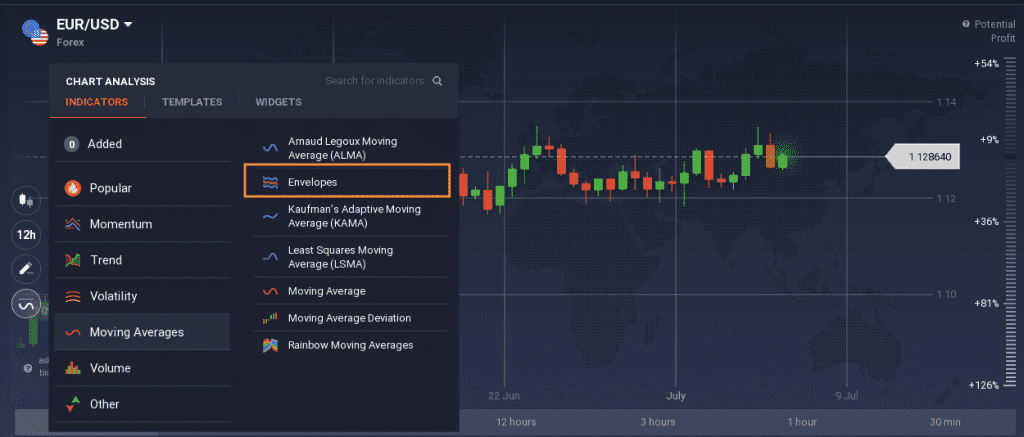
Once you click on it, the settings menu will pop up. Here it is possible to choose the period of the indicator, the deviation, the source (you may choose which value will be taken in the calculation – opening price, closing price, high, low etc.) and the type of the Moving Average.
The upper and lower levels are set in a way that the price keeps within the borders around 90% of the time. This means that the trader can change the deviation according to the volatility of the price. The higher the volatility, the bigger the deviation.
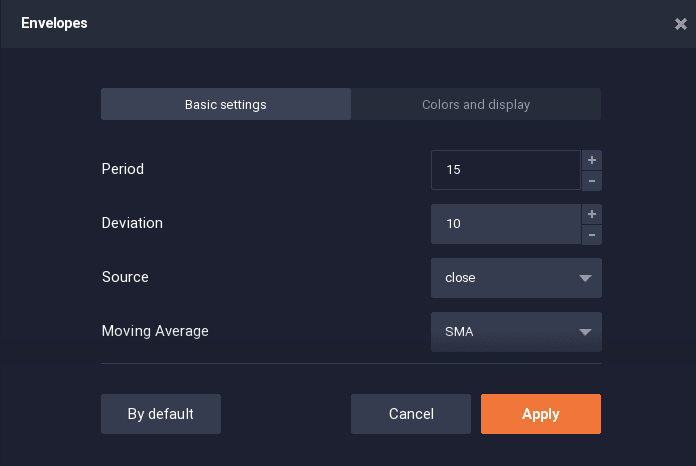
The button “By default” can adjust the indicator to the default values. That is it, the indicator is ready to use!
Conclusion
The Envelopes indicator might be a good alternative to simple Moving Averages and it can provide the trader with a ready-to-use technical analysis system on its own. It can also be well combined with other indicators. However, always keep in mind that there is no 100% guarantee that this indicator will not provide false information from time to time too. You could check if this indicator fits into your trading strategy now that you have a grasp of how it works.

