For many traders and cryptocurrency enthusiasts alike Ripple is still a dark horse. Launched in 2012, the Ripple protocol is aiming to provide “secure, instant and nearly free global financial transactions of any size with no chargebacks.” Over 75 international banks and financial institutions use Ripple in their daily operations. It is believed that the popularity of Ripple among financial sector professionals is driving the cryptocurrency exchange rate up, creating sufficient buying pressure.
During the last one week Ripple has slightly appreciated, returning a 1.43% growth. In the 24-hour period, however, the XRP price grew over 7.6%. The cryptocurrency is currently traded $0.27. What can we expect from the world’s third largest cryptocurrency in the coming days?

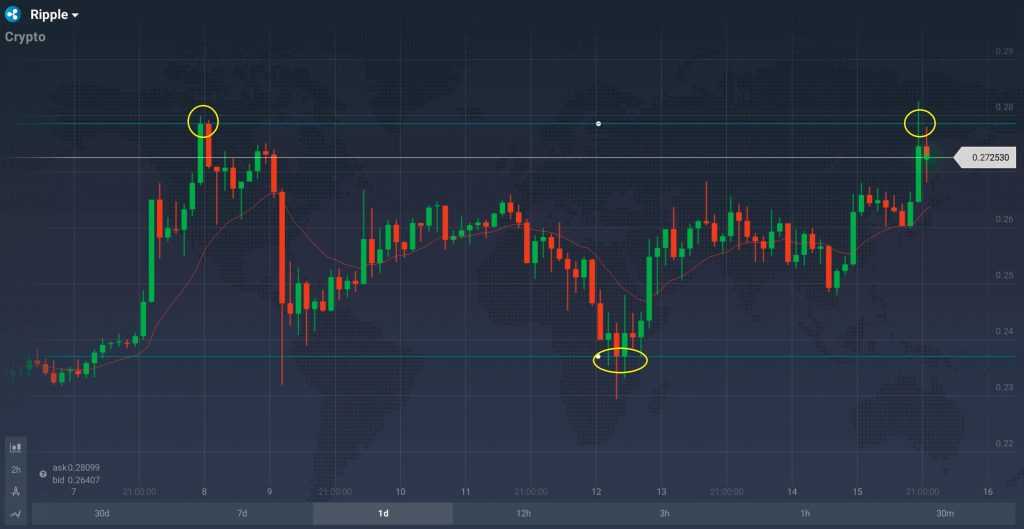
For the last nine days the Ripple price was oscillating in a narrow corridor between $0.23 and $0.27. Strong support and resistance can be observed at the above-mentioned levels. Should the price action cross the resistance level from below, the emergence of a stronger upward trend can be expected. Conversely, should the price action cross the support level from above, the trend may very well turn to negative.

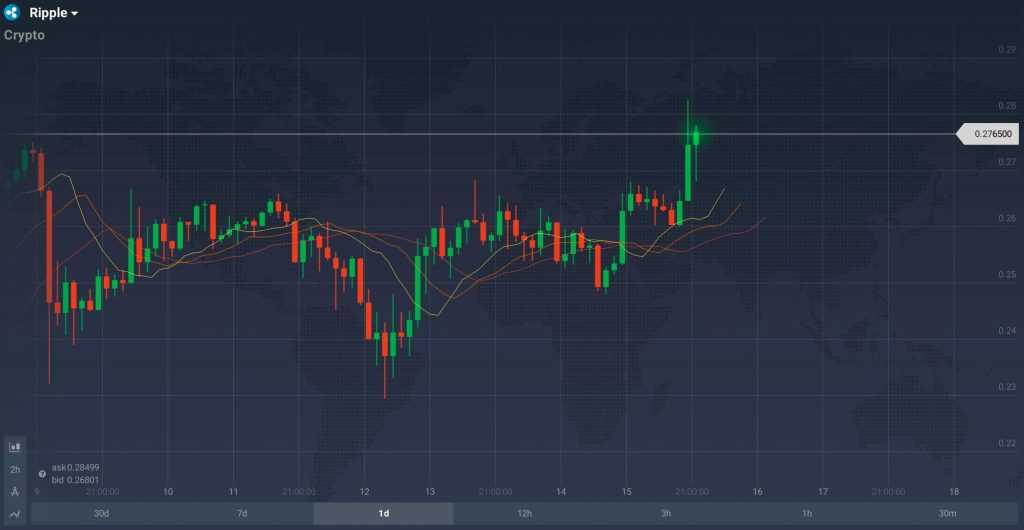
According to the oscillator-type indicators, ADX and MACD, the positive trend is currently dominating the chart. While the overall trend strength is growing, the negative part of it is diminishing. Both short and long-term trends demonstrate upward mobility.

The Alligator technical analysis indicator can provide traders with extensive information on short, medium and long-term trends. All three are currently in the green. Bollinger Bands hint at increasing volatility. The latter usually corresponds to swift price movements, whether positive or negative. In other words, several major technical analysis tools unanimously indicate the presence of a strong positive trend in the XRP price action. Should the Ripple set a new record in the days to come, surpassing $0.41, is yet to be seen.

