All indicators, currently available to you on the IQ Option platform, are there for a reason. All of them can help you determine optimal entry and exit points, elevating your trading results. However, some are even better and more popular than the other. Here is a list of the 5 most popular indicators and ways to use them.
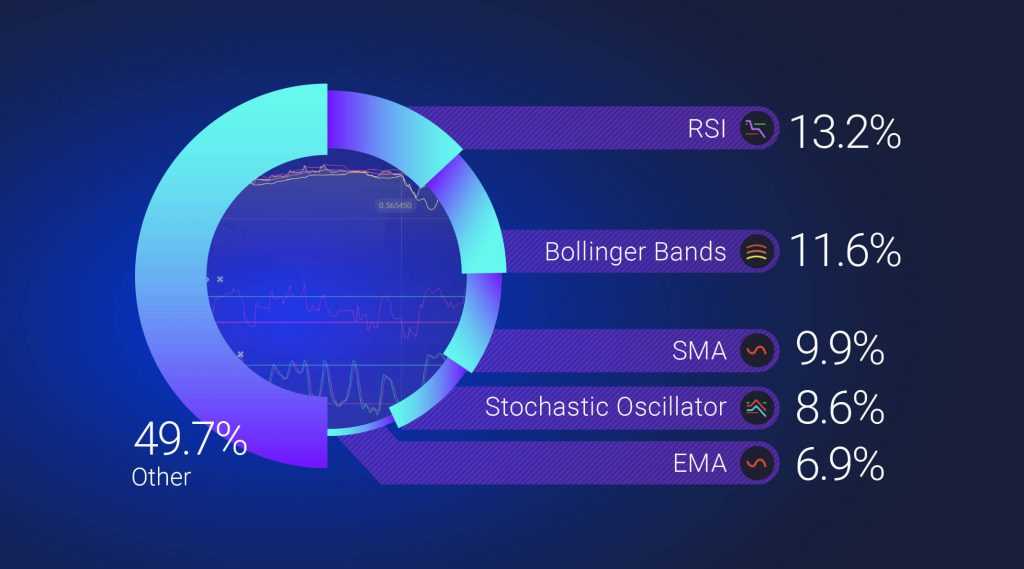
RSI — 13.18%
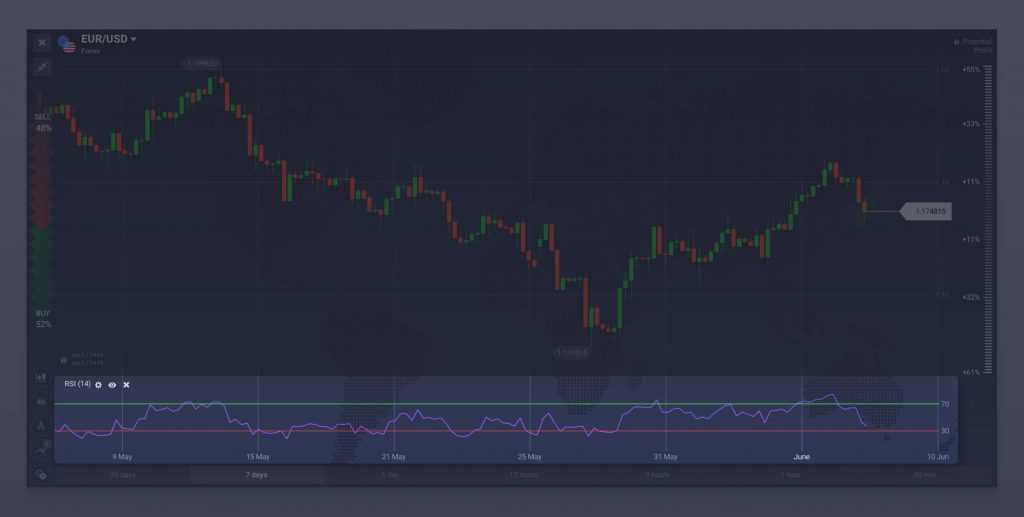
The Relative Strength Index (RSI) is a momentum oscillator, capable of providing the trader with sell or buy signals. The logic behind the indicator is simple. When the asset is overbought, its price is usually higher than the market wants it to be and is likely to decrease soon enough. Conversely, when the asset is oversold, its price is lower that what is considered to be “normal”. The asset, therefore, can be expected to appreciate in the foreseeable future. The RSI can help you determine overbought and oversold positions.
How to set up the RSI indicator
- Choose Relative Strength Index in the list of technical indicators.
- Set the following parameters for the indicator:
- Period – The number of recent candlesticks to use for calculating the indicator values.
- Overbought and Oversold – Horizontal lines in the indicator window that mark the probable overbought and oversold levels (the standard values are 70 and 30).
- The closer the indicator value is to 0, the higher the chance that the asset is oversold and may transition from a falling to a rising trend.
- The closer the indicator value is to 100, the higher the chance that the asset is overbought and there is a possibility of a price reversal from rising to falling.
Want to know more? Read the full article.
Bollinger Bands — 11.56%
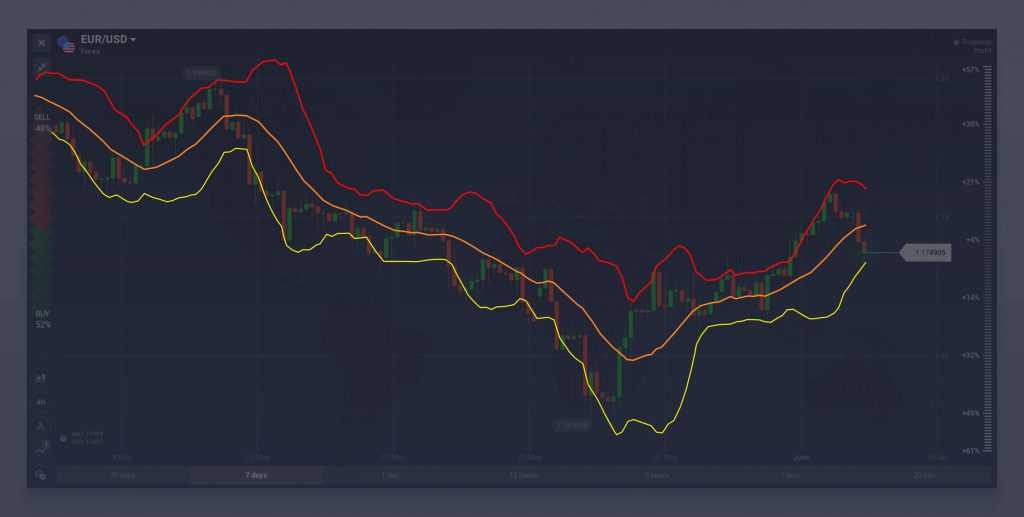
Bollinger Bands are a volatility-tracking indicator. The sole purpose of it is to mark periods of high and low volatility on the price chart. Not meant to be used on its own, this indicator can still complement trend-following or oscillator-type indicators, contributing to the overall effectiveness of your trading activities. When the market is flat it is usually hard to predict the direction of the future price movements. Bollinger Bands will help you determine the prevalent market phase.
How to apply Bollinger Bands
- Choose Bollinger Bands in the list of technical indicators.
- Set the general indicator parameters:
- Period – How many recent candlesticks to use for calculating the lines (normally 20).
- Deviation – The standard deviation of the price from the moving average line.
- Choose the display parameters for the upper, lower, and middle lines.
Important: The indicator settings are very simple, but to use it effectively, you need to study the principles of the algorithm in detail.
According to the indicator’s author, you should consider the following SMA values:
- 10 for short-term trading
- 20 for medium-term trading
- 50 for long-term trading
Read more about Bollinger Bands here: “Bollinger Bands” Indicator.
SMA — 9.97%
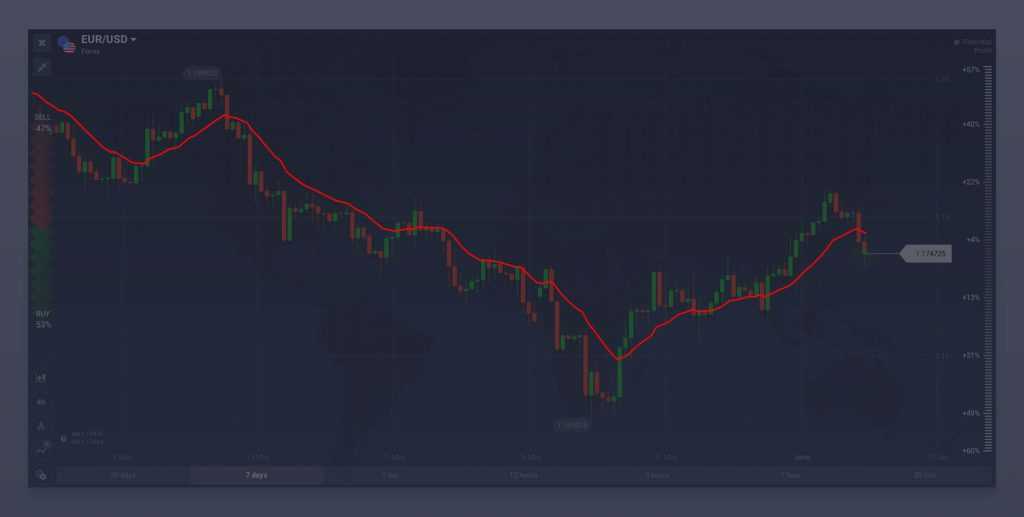
The most basic alteration of the moving average, the Simple Moving Average excels at estimating the prevailing trend. Sometimes the direction of the trend is not obvious. It also happens that a medium-term trend behaves differently than the long-term one. In those cases, the use of an SMA is more than justified. This indicator can also be combined with indicators of different type for the purpose of providing buy and sell signals.
Stochastic Oscillator — 8.56%
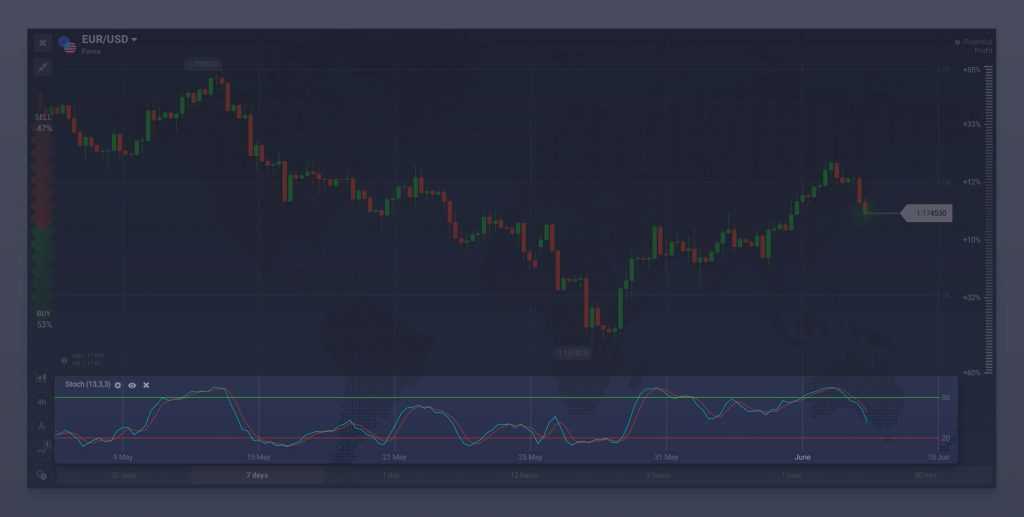
The Stochastic Oscillator is a great technical analysis tool, yet it is hard to master. Being an oscillator-type indicator, it does not follow the trend. Rather, the Stochastic can help you determine overbought and oversold levels (you already know why it is important, right?). There are several different types of trading signals this indicator will send: crossover, convergence and divergence.
How to use the Stochastic Oscillator indicator
- Choose Stochastic Oscillator in the list of technical indicators.
- Set the following parameters for the indicator:
- Period %K – The number of individual periods to use.
- Smoothing coefficient %K – The level of internal smoothing of the %K line (1 is a fast stochastic oscillator, and 3 is a slow one).
- Period %D – The number of individual periods to use for calculating the moving average of the %K line.
If the indicator lines are below the 20% level, this signals the possible beginning of a reversal to rising. The opposite is true when the indicator lines are above the 80% level.
Familiarize yourself with the Stochastic here.
EMA — 6.99%
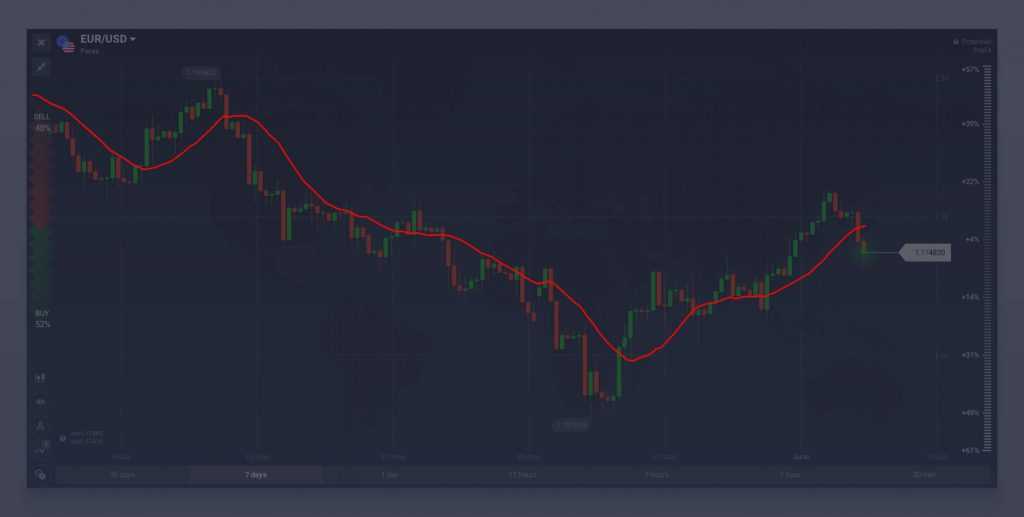
Another variation of the well-known moving average tool. The Exponential Moving Average serves the same purpose the SMA does. Two curves are calculated a little bit differently but still can be used interchangeably depending on your personal preferences. Identify the trend and use (either as a standalone tool or in a combination with other) to determine optimal entry points.
Whatever the indicator you choose, don’t forget to study it and use correctly. The indicator is merely a tool in the hands of a well-prepared trader and is not capable of providing astonishing results by itself. Apply one of the indicators you’ve learned about today to your trading efforts to get better results.
