Bitcoin remains under pressure, but rising market dominance promises to drive it higher.
What dominance means for Bitcoin traders today
After last week’s surprise plunge in BTC prices traders are wondering what will come next? According to new data what comes next may surprise you. Bitcoin, while trading near long-term lows, has regained market dominance and that means a major bull run could be on the way.
Coinmarketcap.com reports that BTC dominance has reached 51.2%. This means that more than half of all value held in digital currency is held in Bitcoin. The last time this happened was just about a year ago, right before the 2017 mega-bull market, and many traders see the same thing happening again.
The current market cap of BTC stands near $111 billion, that billion with a “B”, compared to only $32 billion for second ranked Ethereum and $12 billion for third ranked Ripple.
Why did Bitcoin fall back to $6,500?
Bitcoins recent spike to $8,500 and subsequent fall to $6,500 was sparked by one thing; hope the SEC would approve a BTC ETF. The news has been long anticipated and was expected, for good or bad, later this week. The reason why the ETF is so important is two-fold; a vote of confidence from US regulators and instant, easy access to the multi-trillion-dollar US investment market. The reason why BTC prices fell is because the SEC’s decision to postpone making the decision.
What traders to need to focus on is not the fact the SEC is stonewalling the market but the fact they chose not to immediately dismiss the request from Van Eck. There have been several requests from the investment community for BTC ETFs, most notably from the Winklevoss Twins, and those have all been denied. If the SEC was going to deny the Van Eck request they could have done so without leading the market on; the 45-day postponement suggests they may decide to approve the request this time around.
Where is BTC now?
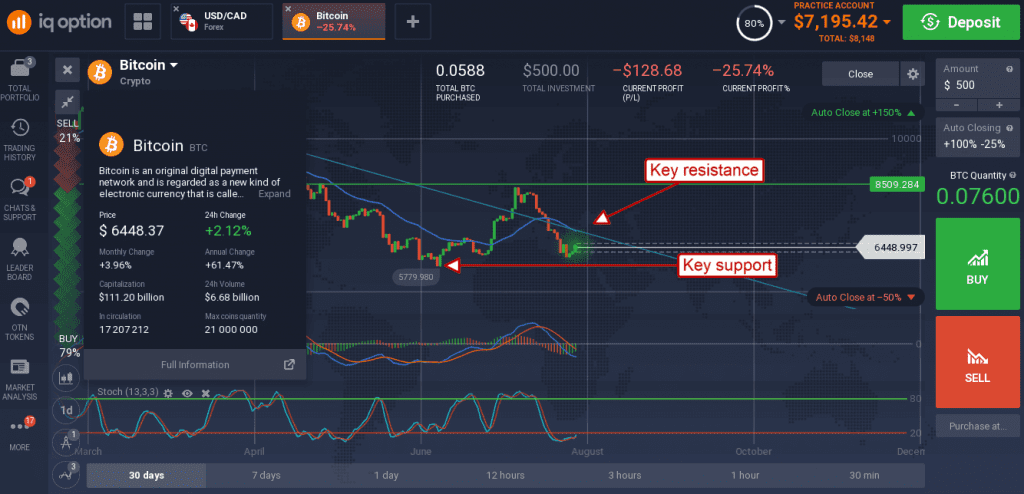
Bitcoin is now trading near the $6,000 support zone and testing resistance at the $6,500 level. The indicators are consistent with a swing in momentum that may drive the token above $6,500 in the near-term but more than that is still questionable.

Once $6,500 is regained there is still significant resistance along the downtrend line connecting the 2018 peaks. A break above that level would be bullish for BTC and the entire cryptocurrency market.

