Continuation signals are awesome, they indicate a strong trend is only half over. Of course, the best time to see a continuation signal like the Bullish Flag Pattern is after you’ve entered a trade but even so they can provide highly profitable entry points. This particular continuation pattern comes with three parts; a rally, a triangle and a break-out that when completed can lead to significant gains in price.
Why is it called a flag pattern? This is because the pattern forms when a symmetrical triangle forms at the end of a strong rally and looks like a flag or pennant waving from a flag-pole. When you see one you think to yourself “there’s a rally trying to flag me down”. The key for traders is to wait for confirmation of the triangle before entering the trade, this will occur at or just after the breakout from the triangle and may include a retest of resistance-turned-to-support.
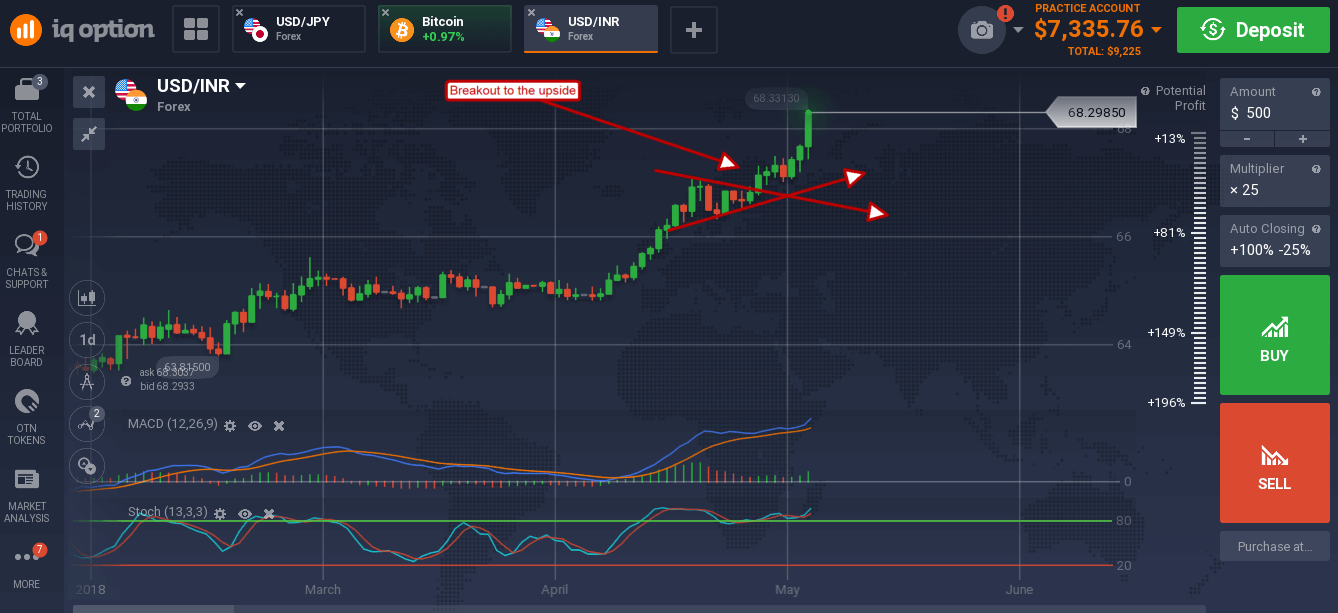
The triangle pattern forms when the rally hits a pocket of resistance. This pocket of resistance may include a small group of traders taking profits or others seeking to cut losses from trades that have gone bad. In either case there are not enough sellers to cause a correction, just enough for prices to consolidate near the new high. While this is going on the balance of power shifts from the bears back to the bulls which results in the breakout. When this happens the previous resistance becomes the new support and the price level at which highly profitable trades can be entered.
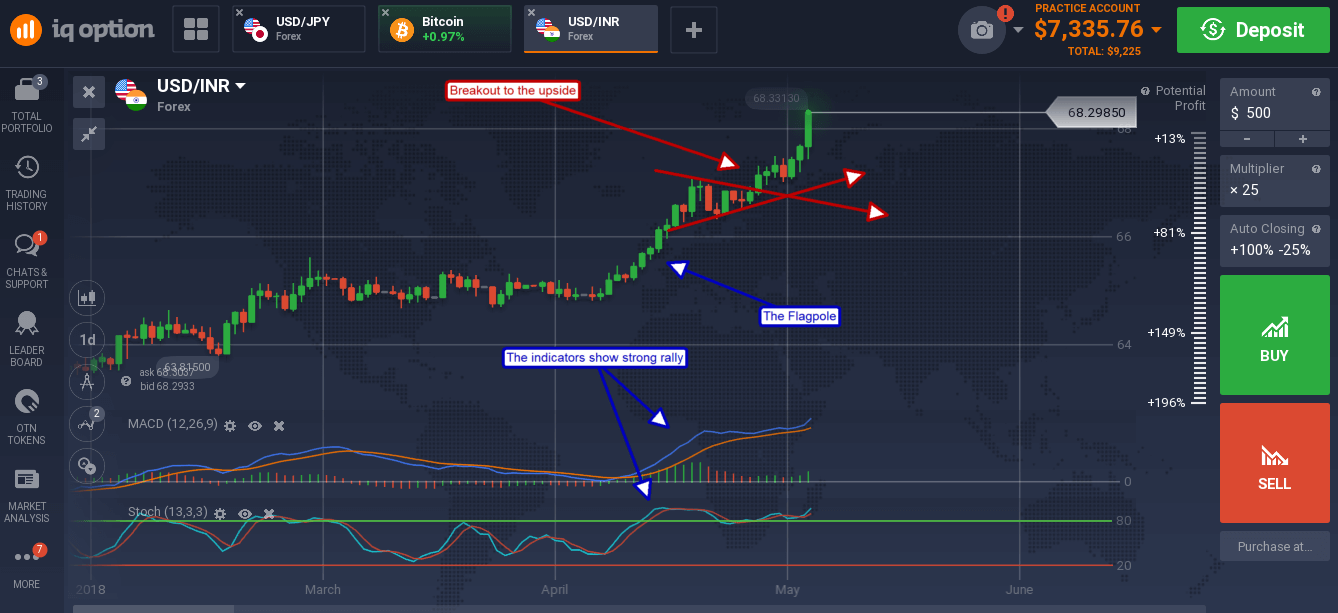
Once prices break out of the triangle, to the upside mind you, we are talking about a bullish flag pattern, wait for prices to pull back and indicate support at the new level before entering trades. Once a trade is entered the profit target can be projected using the Flag-Pole. Measure the magnitude of the flag-pole and then project that amount from the break-out point for your take-profit target. As a point of reference, the flag-pole should be an easily identified up trend that is confirmed by other indicators. The stronger the flag-pole, the stronger the signal.
