A moving average may become a powerful technical analysis tool in the hands of an experienced trader, and even more powerful when it is an exponential moving average. When used together, these two lines form an indicator that is beyond belief. If you still haven’t tried it you probably should consider it.
Simple tool, strong signals
Moving averages are good at what they are doing. They plot average prices of an asset for given period of time on a chart. Moving averages can follow the trend, act as support and resistance lines, detect possible reversal points and even determine potential entry and exit positions. The most basic version of the moving average is a simple moving average (SMA). Each bar in this case is assigned with an equal weight.
Older results, therefore, are as important as the newer ones, which is not always useful. This type of the moving average will track the general level of prices, but at the same time lacks precision. The weighted moving average (WMA) allocates more weight to new candles and less to the older ones. This moving average follows the prices more closely with less room for prices to move. An even more powerful MA is the exponential moving average (EMA), which allocates weights to the fresher data on a geometric scale. It closely follows the prices, but will also give the highest number of false signals. At least, if you don’t have a method of sorting them out.
One of the reasons for MA’s being so powerful is their ability to incorporate multiple time frame analysis. The most recent readings will provide you with short-term information, while the older ones hint at the long-term tendencies. A series of peaks and troughs set by the MA is a long-term trend, the direction it is pointing right now is its short-term one. The MA can also be adjusted, focused if you will, to reveal longer and shorter trends. A long-term EMA may incorporate up to 200 candles, while a short-term one can be only five periods long. To make this tool even more powerful all you have to do is add another EMA to an EMA you already have.
The trader may use a 30 bar EMA as his standard moving average. On a daily chart that’s equal to 30 days which gives a good representation of near term trends. To get signals from this MA will then add a shorter 15 bar EMA as signal line. Now, whenever the short term EMA crosses over the longer one it is an entry signal. This helps weed out false signals given by the 30 EMA on its own as a simple price crossover is not enough to trigger entry.
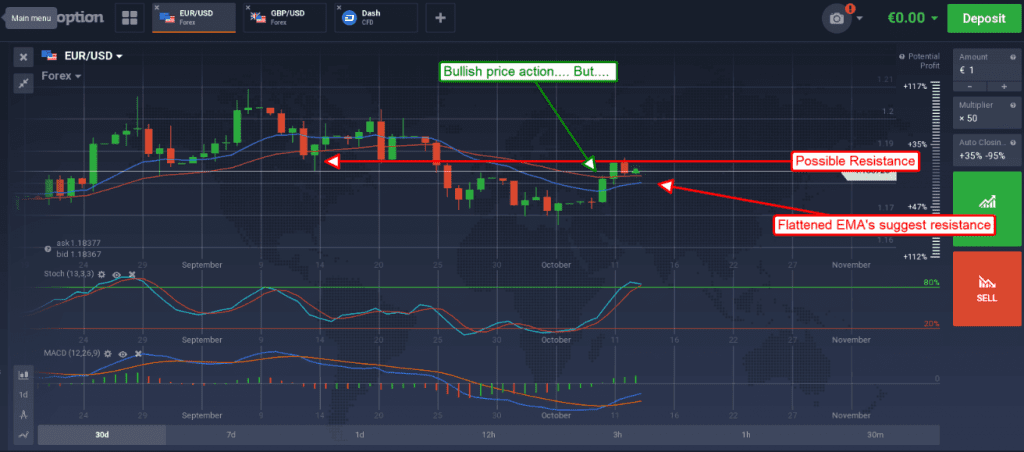
Look at the chart below, it is daily candles for the EUR/USD. Price action is moving up off of a support level and has crossed above both EMA’s. This set-up may look bullish but is not confirmed because the EMA’s have not crossed. In fact, until the EMAs make a bullish crossover this set-up has as much chance of being whipsaw and entry for bearish positions as it does as being bullish, maybe more. If you’ll notice, price is also pushing up against a potential resistance level and that resistance is showing in the EMAs. A fall from this level would confirm that resistance and negate the previous bull move.

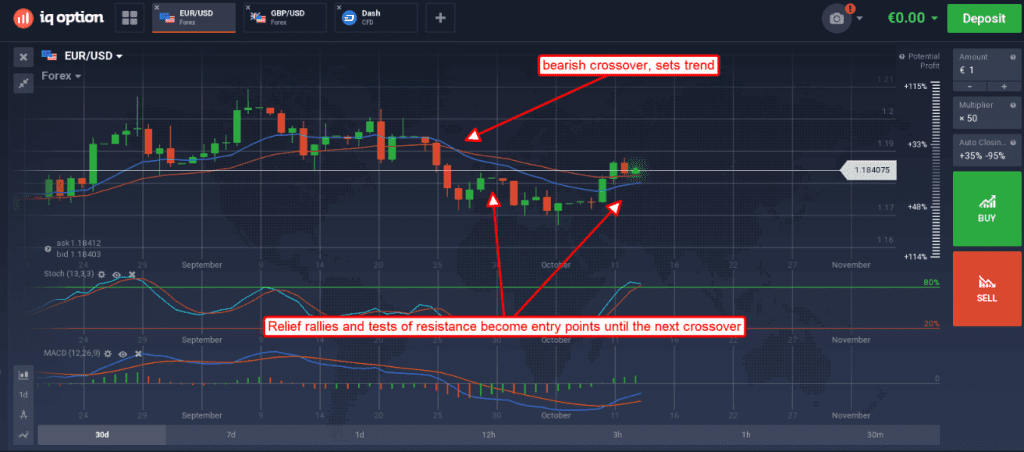
Now, let’s look at the same chart again but this time starting from the most recent EMA crossover that took place about 3 weeks earlier. That crossover set the trend as bearish which makes current price action a relief rally and bearish entry point until confirmed by breaking resistance. Once a crossover is confirmed, that is when the candle in which it forms closes, all trend following signals become possible entry points until the next crossover.

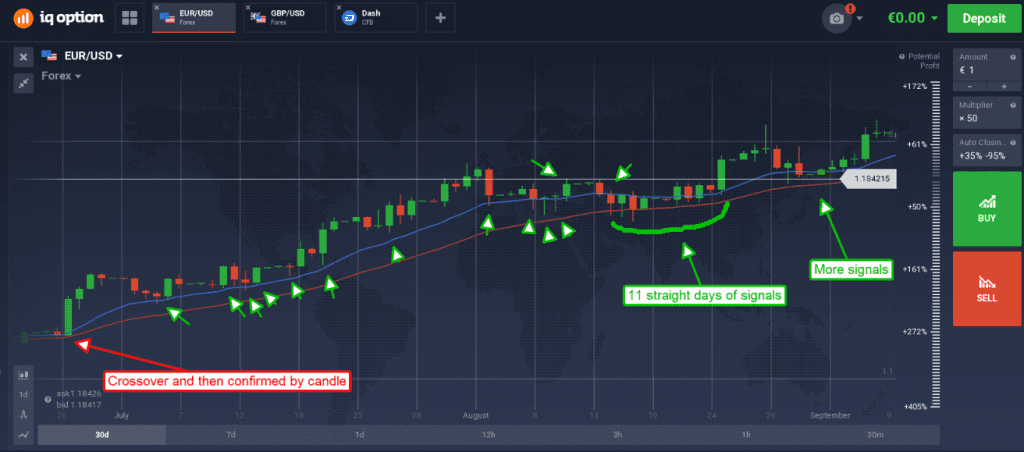
This next chart shows a strong trend as signaled by a moving average crossover and then confirmed by a large green candle. The large green candle moves up form strong support at the long and short term moving averages and the trends higher. Over the course of 2 months the pair touched support at one or both of the EMA’s 28 times and each and every time resulted in a profitable entry. Nevertheless, please note that there is no guarantee that by using the said indicator your investments will result in profit as there is always high risk entailed with trading.

What should be noted is that each entry along the moving average was at support and would have resulted in minimal drawdown. Of course, all things must come to an end and eventually support will fail and another crossover will occur.

