
The Fed decided to hike rates by setting a target range of 1.75% to 2.00% (previous 1.50% to 1.75%) but the greenback didn’t have a huge reaction because the change was anticipated and priced into the market. This brought the ECB into focus and a dovish Presser early in Thursday’s session triggered EUR selling. The ECB indicated an end to QE, as expected, but they didn’t sound too confident in their assessment of the economy.
The big picture
The economic calendar is light on Friday, with the only notable release being the University of Michigan Consumer Sentiment survey scheduled at 2:00 pm GMT. As the name suggests, the survey gauges consumer confidence and overall opinion on the state of the economy; a confident consumer is likely to spend more, thus boosting spending levels, so numbers above forecast are beneficial for the US Dollar. Forecast: 98.5 (previous 98.0). Impact: Medium to low.
Deciphering the technical chart
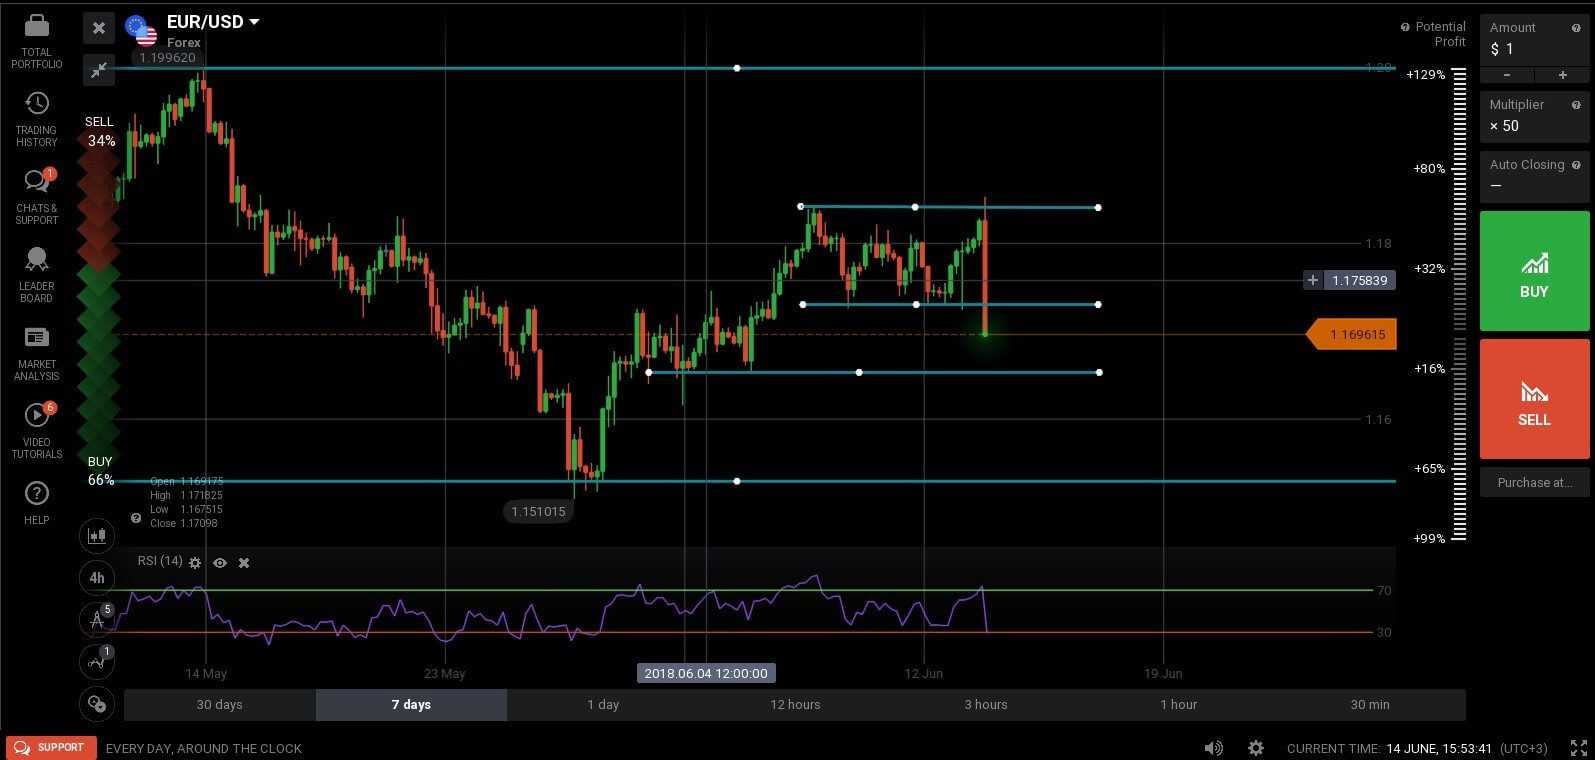
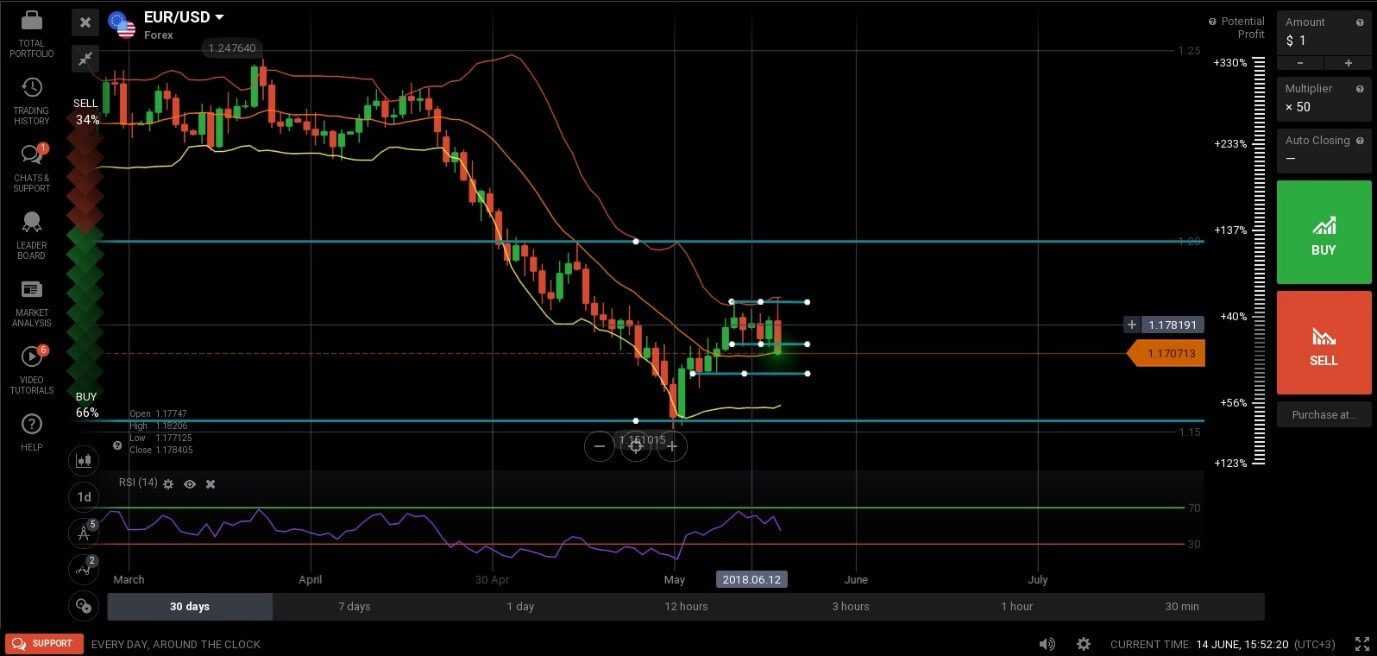
We can clearly see a horizontal channel represented by the resistance at 1.1840 (1.1850) and the support at 1.1730. The break of either side will determine the next direction. A break of the lower boundary will take the pair into the next support, located at 1.1650, while a bounce from the current price and a break of resistance will make 1.2000 the next target, albeit it will take a longer time for such a move to conclude. At the time of writing, the 4H candle that broke the lower boundary is not closed. If the candle closes below the level, the break to lower prices will be confirmed.
Support zones: 1.1700 – 1.1730 (lower side of the channel)
Resistance zones: 1.1840 – 1.1850 (upper boundary of the channel), followed by 1.2000 in the longer term
Most likely scenario: Given that the lower side of the channel appears to be broken, we favour a bearish move into the next support around 1.1650.
Alternate scenario: Move up from current prices to reach the upper side of the channel
Pound boosted by Retail Sales. Gains nullified by USD strength
The Sterling was boosted by better than anticipated British Retail Sales early during Thursday’s trading session (expected change 0.5%, actual 1.3% – monthly numbers). However, the pair dropped later in the day due to fresh USD buying orders and GBP selling triggered by strong US data. US retail sales and jobless figures show continued strength in the economy, bullish for the dollar.
Deciphering the technical chart

After re-testing the bullish trend line that was previously broken, the pair dropped to reach a support target around 1.3000 and is now showing rejection. This action paints a blurry picture, without a clear bias and choppy price action, but the US Dollar is showing some signs of strength which could translate into a break of the support on the 4H chart above. The Relative Strength Index is not oversold which means that there is still room for bearish movement, bullish traders should beware.
Support zones: 1.3300, followed by 1.3250 and the low at 1.3200
Resistance zones: 1.3440 – 1.3475 followed by 1.3500 (psychological level)
Most likely scenario: choppy price action with relatively tight ranges
