The price of Bitcoin moved above $7,000 for the first time in nearly a month and may go higher. The near-term indication is up, and the downtrend is over but that doesn’t mean you should expect a new all-time high too soon. While it is likely the world’s leading digital currency will move up to a new all-time high it’s also likely the market isn’t going to go straight up from here. The downtrend may be broken but that doesn’t mean a rally has begun.
Tuesday’s price action is a continuation of a move above a key long-term downtrend line and is the second such break of that line, also a major target for resistance. The move is also supported by the short-term 30-day EMA which has rolled over in confirmation of today’s move and a bottom in prices. The indicators are both bullish and pointing higher, so price momentum alone may carry the coin up to the next resistance target.
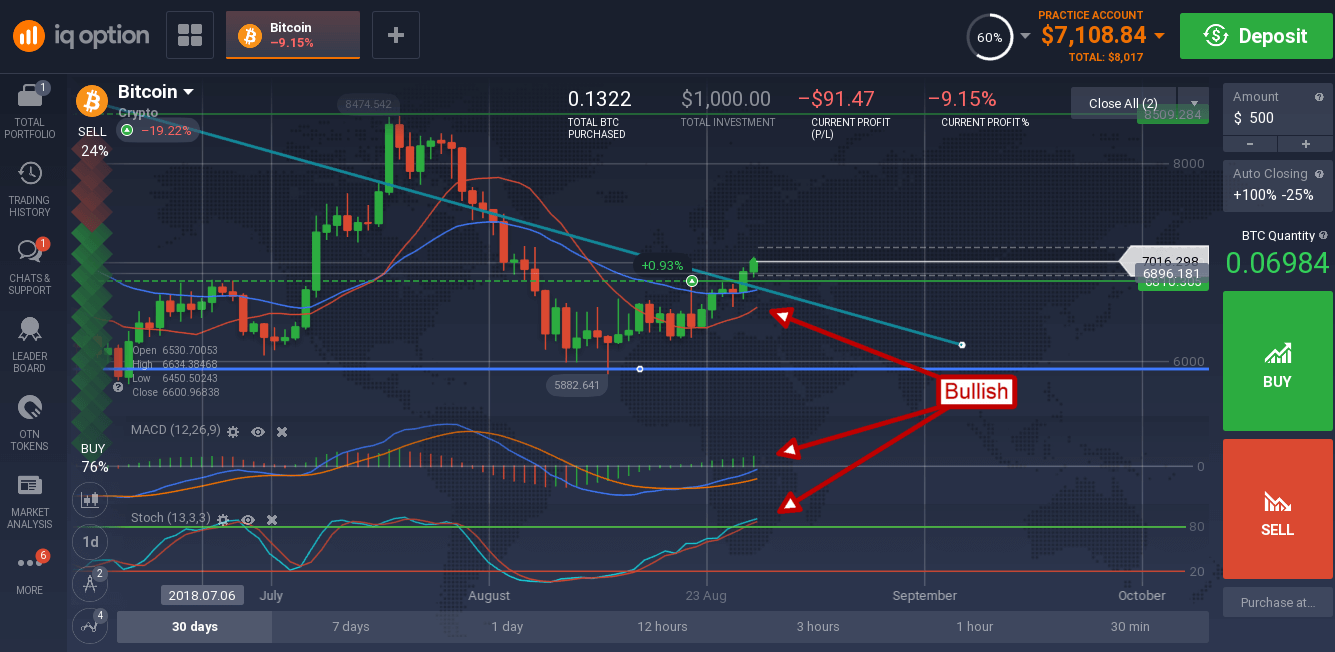
The first target for resistance is near $7,200, a level which has been significant over the past few months. A move above that would be bullish and likely take the token up to $8,400. A move above $8,400 is not likely currently unless a positive catalyst emerges. That catalyst could be an SEC approval of a BTC ETF or other event, or simply an inrush of capital as market participants flock back to this trade.
In the medium-term traders should expect the token to enter a trading range that may result in a retest of key support targets, possibly as low as $5,800 if no supporting catalysts emerge. Longer-term a move up to retest the all-time is expected as global regulatory and market acceptance of cryptocurrency expands.
BTC is leading the market and well off its lows, if others follow suite traders could see big gains in the next few days and weeks. Ethereum’s native token Ether (ETH) traded flat in the early Tuesday session, near its long-term low and below a potentially strong point of resistance.
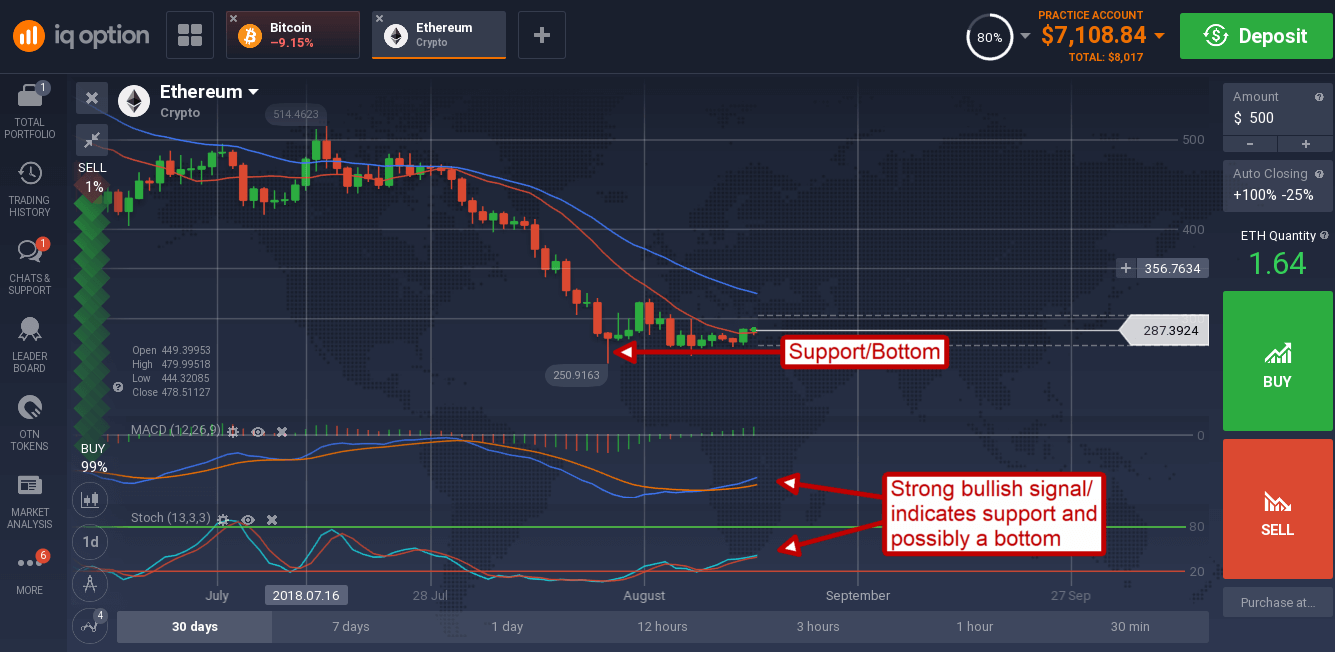
Resistance is near $295 and could result in a big pop in prices when it is broken. The indicators are confirming current levels as the bottom by showing a strong buy signal that could take prices all the way to $400 before hitting major resistance.
