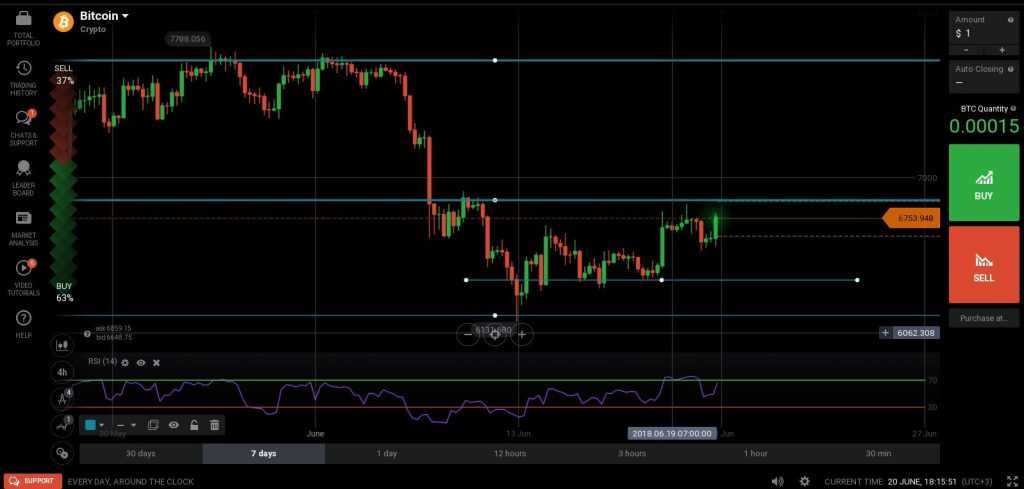
Bitcoin seems lively again and looks like it’s going to erase some of the losses sustained earlier this month. The last few candles are bullish, showing support at the long term low and that investors are starting to come back to the “digital Gold”.

The big picture
A big part of Bitcoin’s downfall was due to the fact some voices attributed Bitcoin’s rise in late 201 to manipulation of the Tether (USDT), and that Tether is not backed 1 to 1 by US Dollars.
Now new information shining favorable light on Bitcoin: according to an informal research performed by the law firm of former FBI Director Louis Freeh, Tether may indeed have the cash to back itself up after all. Currently, there are about $2.55 billion Tethers in circulation and a similar sum has been witnessed in accounts belonging to Tether’s issuer.
This could mean that Tether is backed 1 to one by US Dollars and that Bitcoin’s rise was not artificial, that those purchases of BTC at $19,000 USD were real and that is great news. Now, a full audit has not been performed so we only have bits of information at this point. Is it enough to drive FOMO and push Bitcoin? I’d say YES but we’ll see if the market is on board soon enough.
Deciphering the technical chart

The pair has seen a solid climb to around $6,800 after a failed attempt to break the minor support around $6,400 and is trading around $6,750 at the time of writing. It’s very possible to see a quick climb into $6,900 because the current chart looks bullish, but it must be noted that the Relative Strength Index has already reached overbought. This is an early sign that a retracement lower could come but doesn’t tell when it may start. A climb can go on for quite a long while with the RSI in overbought, so this is not a sell signal, just a warning.
Support zones: $6,550 followed by $6,400
Resistance zones: $6,850 – $6,900
Most likely scenario: continuation of the latest move up and a climb above resistance
Alternate scenario: tight range, with choppy price action and a slight bearish bias
Ethereum poised and rising
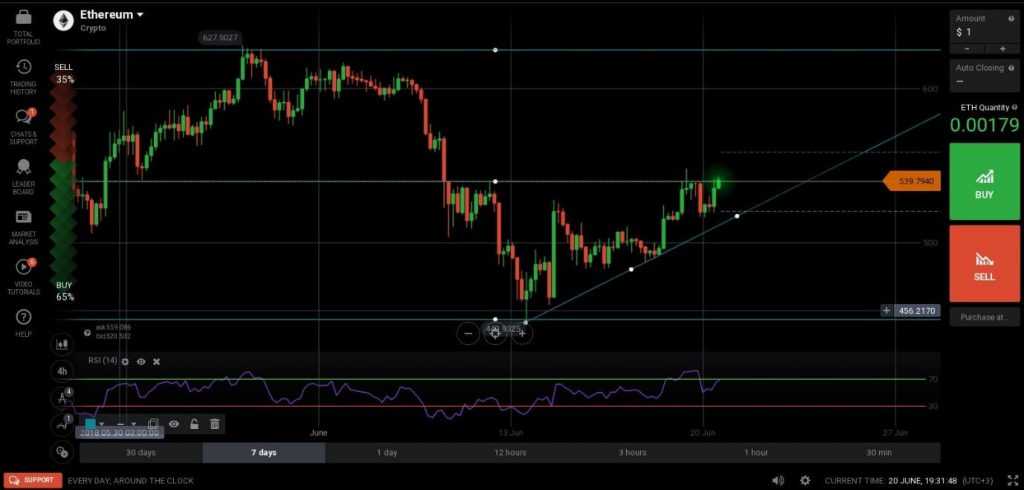
Ethereum is on a healthy rise since the low at $450 and is trading at $540 against the US Dollar Wednesday afternoon. From a longer-term perspective, the picture is a bit blurry, without a clear trend in place, but in the short term the bulls are winning the battle.

Deciphering the technical chart
The pair is currently testing the resistance zone at $540 but the Relative Strength Index is approaching its 70 mark, which makes it overbought and thus in need of a retracement lower. As mentioned before, the RSI in overbought does not mean that price will reverse immediately but it is an early warning sign that should be noted. The pair is supported by a bullish trend line and as long as that remains intact, the bias is clearly bullish even if retracements do occur.
Support zone: the trend line seen on the chart above
Resistance zone: $540, followed by $625 in the longer term
Most likely scenario: break of immediate resistance and climb to $600 (psychological level)
Alternate scenario: retracement lower if the RSI becomes overbought

