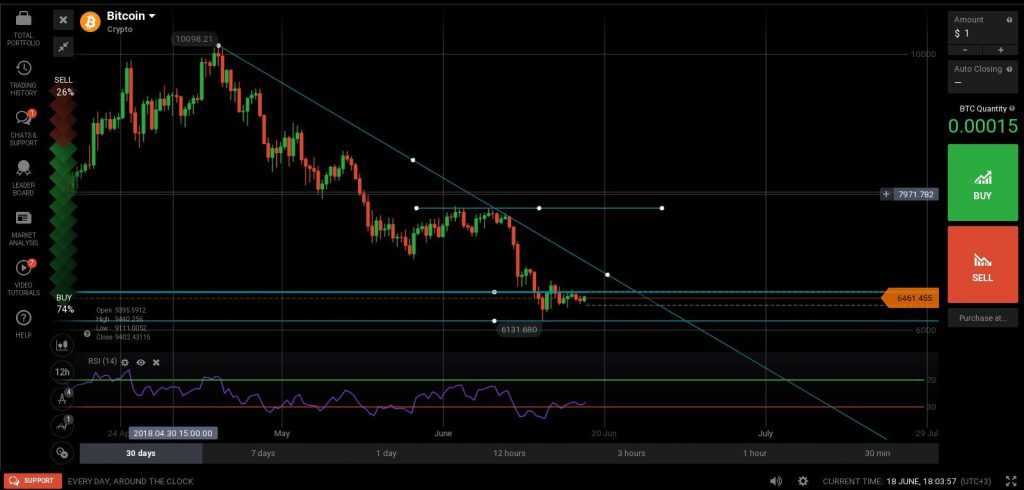
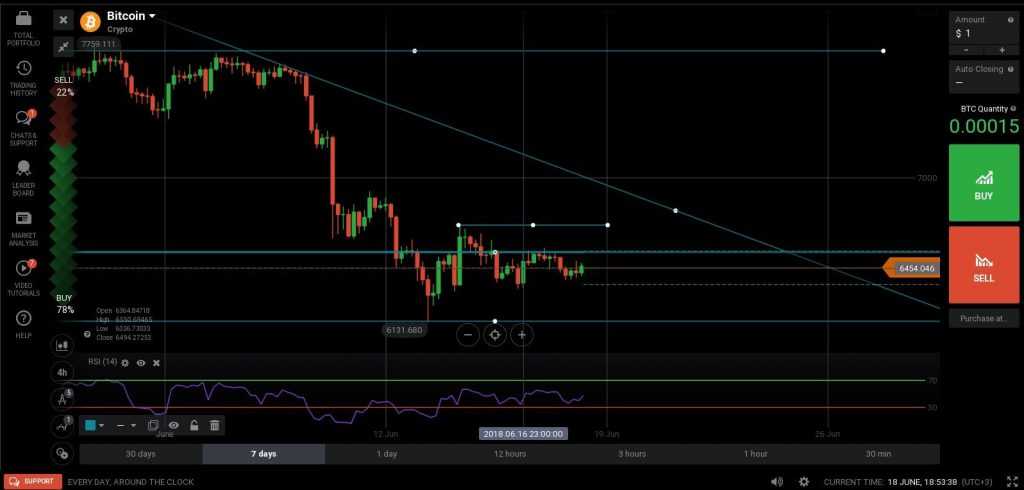
Bitcoin remained relatively range-bound over the weekend, without a whole lot of movement. Usually periods of low volatility like this one is usually followed by strong movement, but the direction is hard to anticipate.

The big picture
France is taking one more step towards large scale crypto adoption by creating the first Blockchain Startup Accelerator, called Chain Accelerator. It is based in Paris and its main goal is to offer help to new blockchain firms. There’s a plethora of recognizable names behind the project so overall, this is bullish for the Bitcoin and cryptocurrencies, but I don’t expect to see huge jumps right away.
Deciphering the technical chart

As mentioned before, Bitcoin is stuck in a range with a bottom at $6,131 and a top around $6,550, followed by another resistance at $6,700 and the bearish trend line. That’s quite a lot of resistance level to overcome, and the trend is bearish for the medium term, so the rule of thumb says that we will see another drop. However, trends can change in an instant, especially in the volatile world of crypto, so the best choice would be to wait for a break of the range that was just mentioned. With volatility and volume so low a move could happen at any time.
Support zones: $6,330 followed by $6,131
Resistance zones: $6.550 and $6,700
Likely scenario: choppy price action until a clear break of either support or resistance occurs
Good news doesn’t always mean higher prices
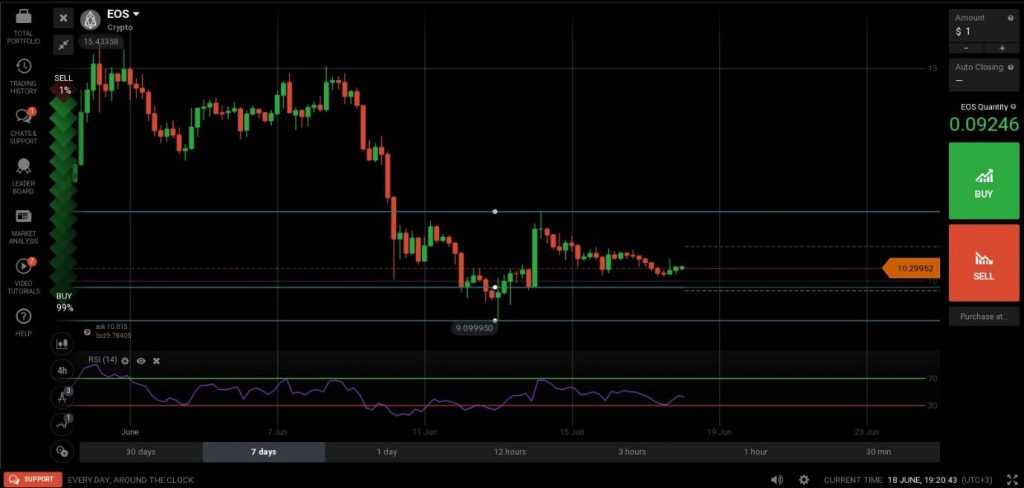
Despite good news related to the launch of EOSIO public blockchain, the pair is still lingering around the $10.00 mark. This doesn’t mean that a climb won’t follow but for now the market is still reluctant to commit to this coin.

Deciphering the technical chart
After the big bullish candle seen last week, the pair showed a long wicked doji candle which is a sign of indecision or rejection. In this case it was the latter (rejection) and bullish pressure waned, being overtaken by a wave of selling.
Now it seems like a bottom is forming around $10.12, so we may soon see a push higher towards where the initial rejection took place ($11.65). Despite the recent drop the outlook is still bullish and I am anticipating a climb. The Relative Strength Index supports such a view by rising after a touch of its 30 level (which represents oversold). If the bounce continues, the first target will become $11.00 as psychological level, followed by $11.65 as a technical resistance.
Support zones: minor support at $10.10, followed by the low at $9.09
Resistance zones: $10.80 followed by $11.00 and $11.65
Most likely scenario: climb to resistance, followed by a breakout
Alternate scenario: ranging price action with a bearish bias.

