US labor data was stronger than expected helping to lift the dollar in early Friday trading. The news, NFP job gains of 223,000, shows solid improvement in the labor market, a down tick in unemployment and upward pressure for wages. Unemployment fell to 3.8%, the lowest level in more than 18 years, while wages grew at a monthly pace of 0.3%. The data in aggregate supports the need for an FOMC rate hike two weeks from now, supporting the dollar in the near term, but does little to make traders think there will be additional rate hikes later this year.
On a year over year basis average hourly earnings grew at a pace of 2.7%. This is above the FOMC’s 2% target rate but with some mitigating factors. The first is that wage increases are in line with expectations, the second that wage growth has been holding steady over the past two years, the third is that underlying core inflation as revealed by Thursday’s PCE price index shows inflation is well contained and the fourth that the FOMC has said they would like to see core inflation run above 2% for a short time before acting firmly to control it.
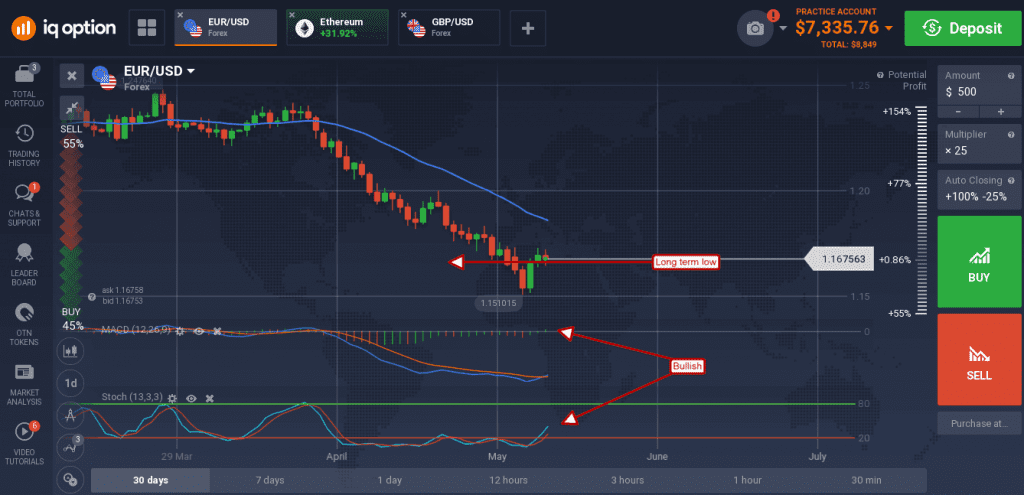
What this has resulted in is a decline in expectation for forward rate hikes that has opened the door to a decline for the dollar. If next week’s data from the EU is anything like this week’s EU CPI figures (hot) the EUR/USD could see its rebound in price continue higher. The pair formed a small spinning top candle in early Friday trading that indicates indecision in the market. The candle has a bullish bias because it is confirming support at a long-term support target that is confirmed by the indicators. The indicators are both forming bullish crossovers that suggest a move up to the 1.8575 level is on the way.

The dollar tried to move up against the British pound but could not gain traction. Data released from the UK, manufacturing PMI, was better than expected and accelerating from the previous month providing positive stimulus for the pound.
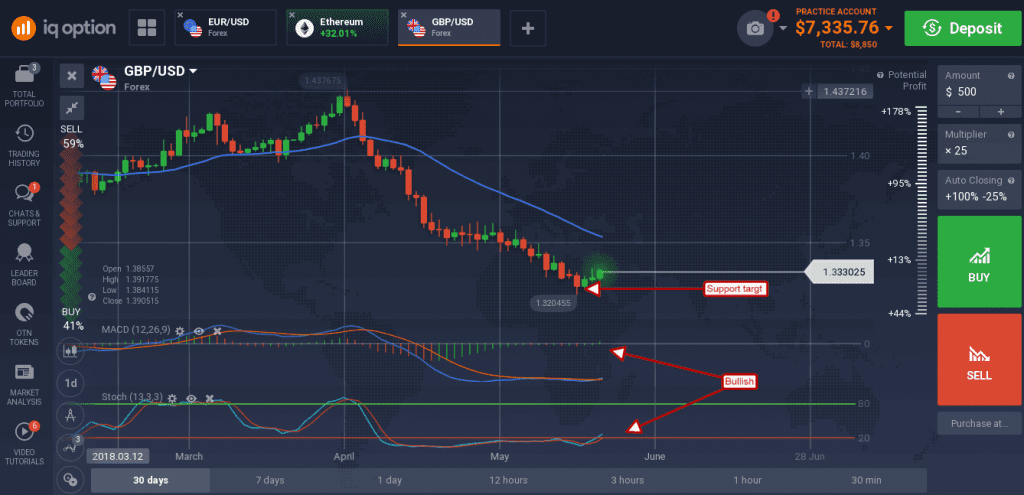
The GBP/USD created a small green candle with visible lower shadow, indicative of support, and moving up from a long-term support target. The move is not strong but, when coupled with the indicators, suggest a change in the tide is at hand. A move up will likely see the pair retrace to the 1.3525 or higher.

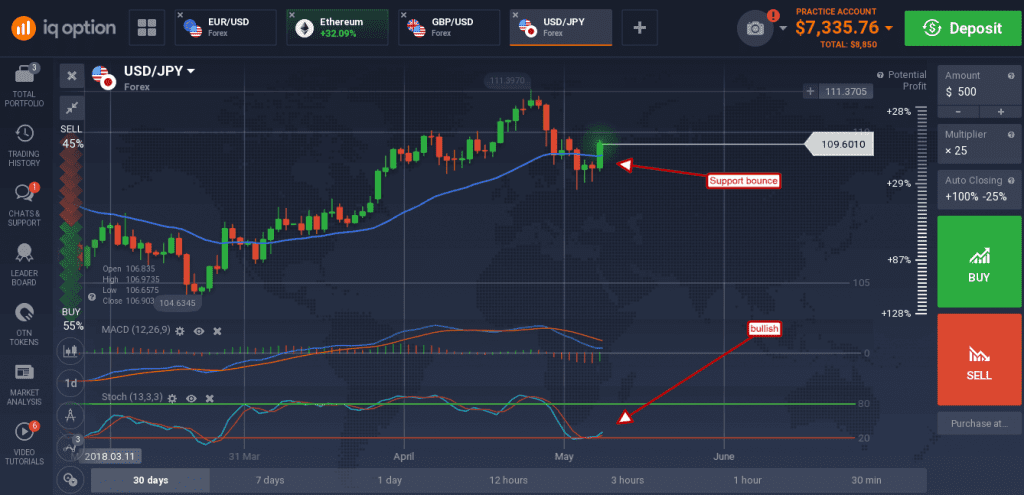
The USD was able to make gains versus the yen that indicate risk-off sentiment has waned. The USD/JPY created a long green candle moving up through the short term moving average and confirming support at the 109.00 level.

The move is trend following and supported in part by the indicators. Stochastic is forming a bullish crossover but MACD has yet to confirm, when and if it does a move up to 111.00 should be expected.

