The Bank of England decided to keep the rate unchanged, as expected, but the Rate Statement was more bullish than most of the market expected. On top of that, 3 members from the total 9 voted for an increase when only two had been expected (previously only 2 members were pro-hike). This was very unexpected and played a major role in today’s action.

The big picture
The Pound is bullish for the time being, boosted by the hawkish twist to BOE policy, but the economic calendar is light today, so we may experience a slow trading session. The only notable event is the OPEC Meetings, which are usually held in Vienna and are attended by representatives of the 13 oil-rich nations. The meetings have a strong impact on oil, not so much on the Forex market but nonetheless, it’s an event that traders must be aware of.
Deciphering the technical chart

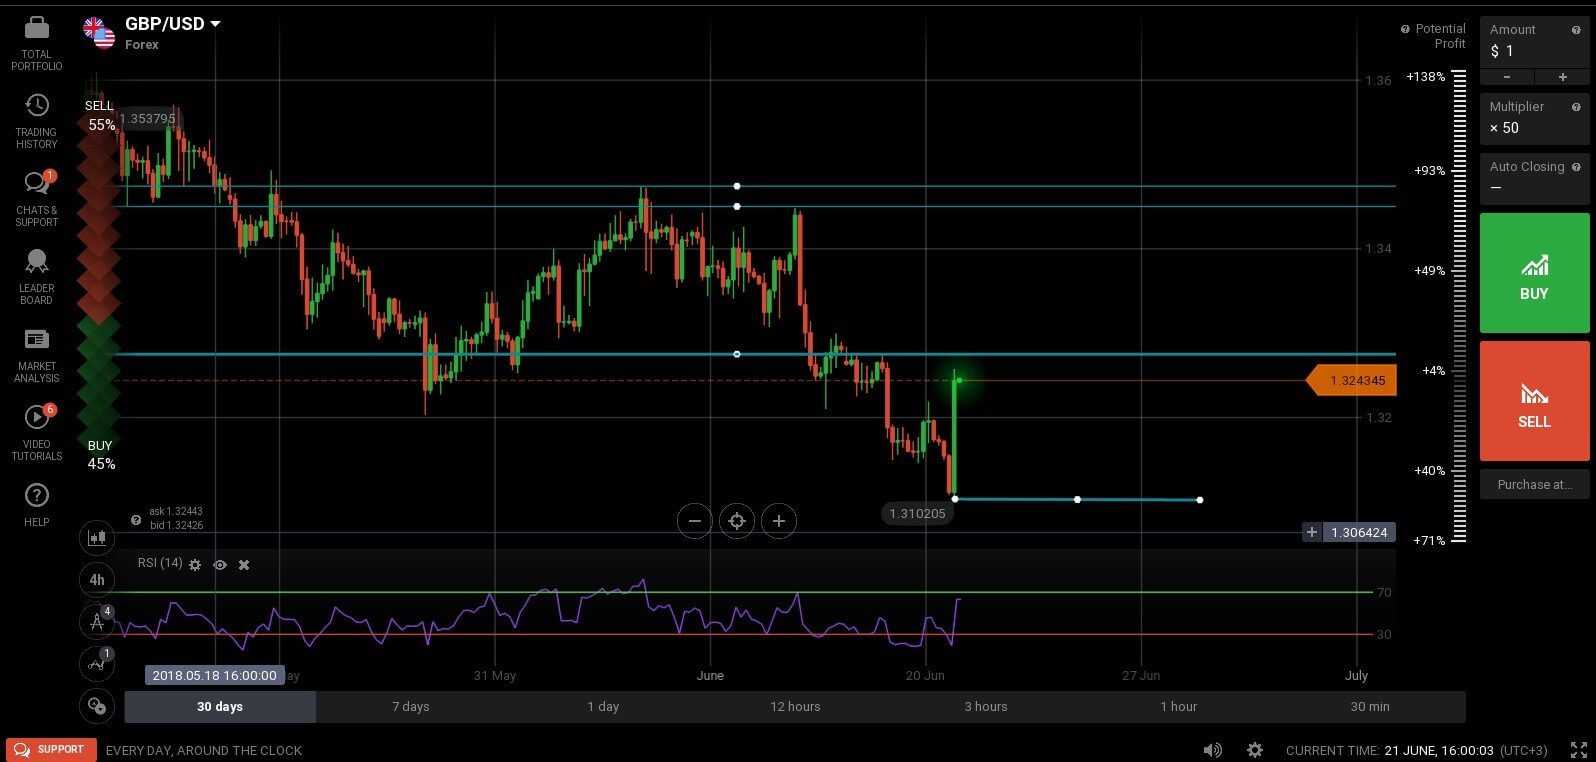
The jump seen on the 4H chart is the perfect example of fundamentals and technical coming together to create a huge move. The Relative Strength Index was creating lows below its 30 mark (oversold) and was showing bullish divergence so the pair needed a “breather” in the form of upward retracement. Hawkish BOE comments took care of the fundamental side, and provided a catalyst, and there you have it: a climb of over 150 pips in just a few hours.
In the short term we can expect to see a touch or even break of the minor resistance around 1.3275 but the extent of the climb should be limited because the pair is in a clear downtrend.
Support zone: the low at 1.3100
Resistance zone: 1.3450 – 1.3475
Most likely scenario: a continuation of the bullish move through the first resistance, followed by a move down
Alternate scenario: extended move to the upside and the beginning of a bullish period
Yen bounces up and down, struggles for direction
The USD/JPY is moving erratically lately, with massive swings and a lack of clear direction, as central bank outlook and risk-on/risk-off sentiment dominates the market. Thursday the Philly Fed Manufacturing Index came out with a value of 19.9, which was way below the expected 28.9 and this weakened the US Dollar, making the pair drop after a touch of the resistance at 110.75.

Deciphering the technical chart
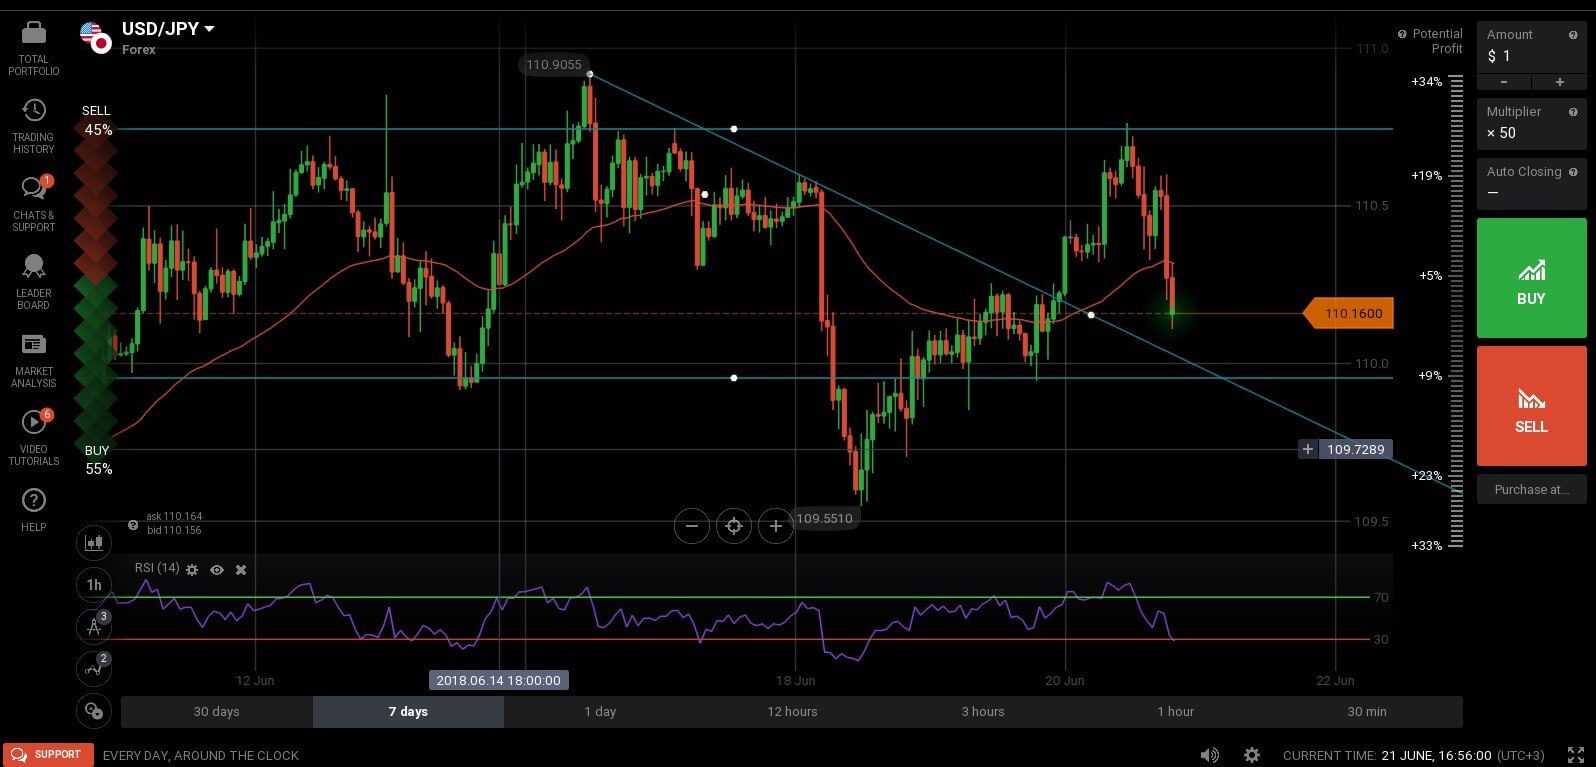
After breaking the bullish trend line, the pair reached the resistance at 110.75 where bullish strength faded, aided by the disappointing U.S. data. Currently, price is trading near the previously broken trend line, which may turn into support and eventually push it higher. Around the same level we can see a horizontal support line, which in conjunction with the trend line will create a confluence zone, which can be a very strong support zone (i.e.: price may jump higher from there).
On the other hand, a break of said zone will show increased bearish pressure, so we may see an extended drop, possibly into the previous low at 109.55.
Support zone: the bearish trend line and 109.95 – 110.00 (confluence)
Resistance zone: 110.75
Most likely scenario: choppy/ranging price action with a bearish bias
Alternate scenario: strong move through the confluence zone of support and a touch of the previous low in the days to come.

