The month of November has been one of extreme volatility, and many assets grew significantly during its second half. It was an especially remarkable month for cryptocurrency, as many assets almost doubled in price. But will this trend follow in December?
November started with huge uncertainty around the US presidential election, but by the end of it, with the release of the news regarding COVID-19 treatments, the stock market reacted strongly and optimistically. Still, many analysts have serious doubts that the wave of higher highs will continue for much longer. The reason for that is the falling profits of American companies, which was caused by the instability and negative data from around the world.
We have picked several assets and used a combination of RSI and Bollinger Bands indicators to analyze the price charts. Though the past movement of the price is not always an accurate indicator of its future changes, technical analysis may be a strong tool for both short and long term traders, if used correctly.
The analysis offered is an example of technical analysis application. It consists of data based on two indicators only, so it cannot be perceived as 100% correct information. We encourage traders to conduct their own investigation and analysis before forming their final opinion.
Stocks
As the success of the coronavirus vaccine was shared, European stocks reacted quite strongly and many still remain mostly on the rise. The optimism regarding the improvement of the situation in 2021 may play a big role in the major jump of the stocks. For instance, easyJet is currently traded at the level of 939.7 GBX, more than 400 pounds higher than at the beginning of November.
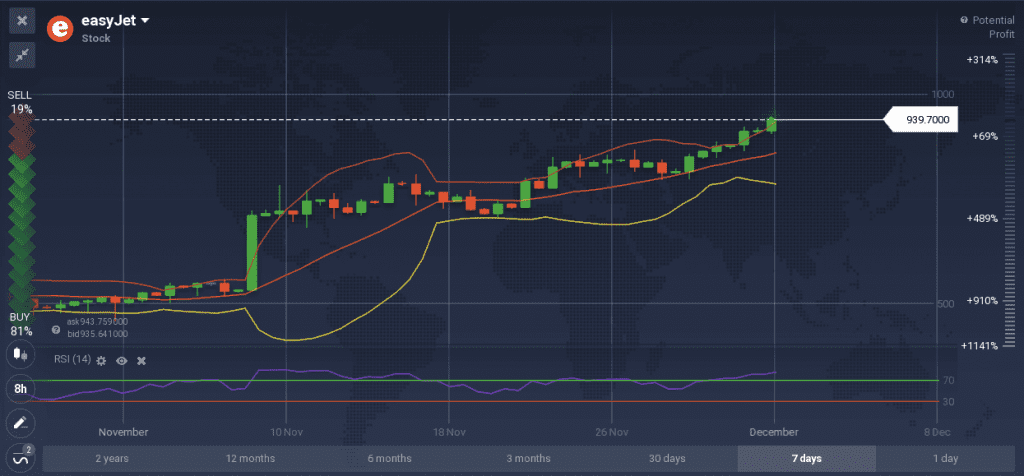
A popular combination of two indicators — Bollinger Bands and RSI was used to evaluate the current state of the asset. RSI indicates that easyJet has been in the oversold area for a while now, however, that does not always mean an immediate reversal. As Bollinger Bands indicate, the trend seems to be on the rise again and the stock may reach new heights, that is, if an unexpected news forecast does not jeopardize the airline industry again.
November has also been a good month for the IT industry. For instance, after getting accepted to the S&P 500 index, Tesla has grown rapidly and from $385 at the beginning of November it jumped to the current $593.
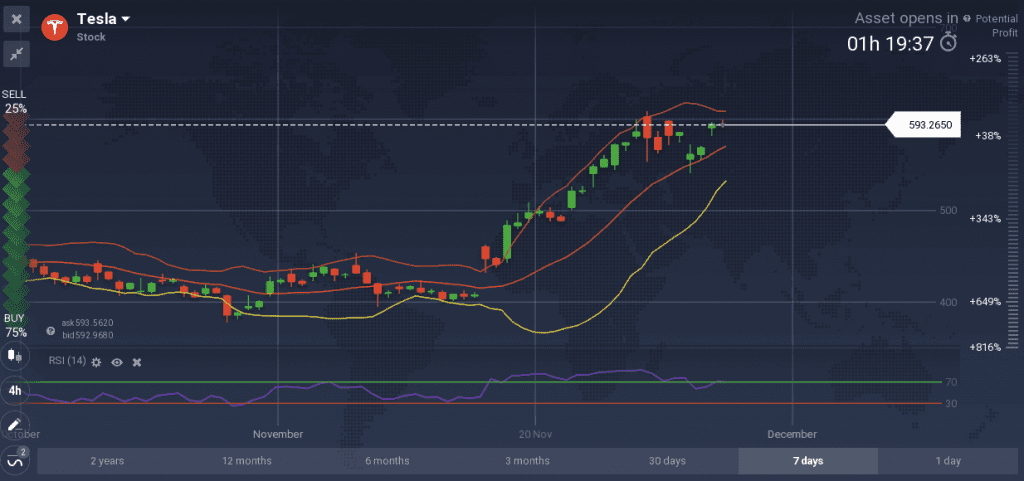
Though Tesla is still going strong, as both indicators show, a reversal of the trend, at least a temporary one, is not impossible. Overbought periods are normally followed by a correction and it would not be unreasonable to expect this rapid movement to slow down.
Crypto
Cryptocurrencies, with Bitcoin ahead of them all, have also shown stunning results. Bitcoin has reached its all time high point — $19,857, breaking its 2017 record.
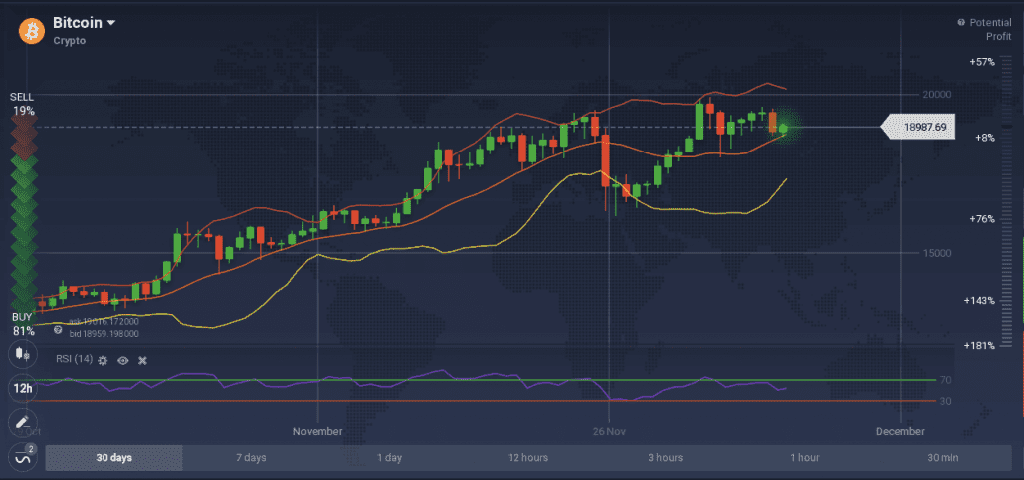
The indicators suggest the continuation of the bullish trend, which might mean new remarkable highs in the future. The same situation may be seen on other crypto coins, like Ethereum, and the much less expensive Dash. This crypto high may linger for a while and, who knows, crypto investors may witness BTC worth $20,000 if the growth continues at such rates.
Commodities
While Gold recently broke out of its descending pattern and was on the rise for the most part of last week, currently it seems that another drop might be inevitable.
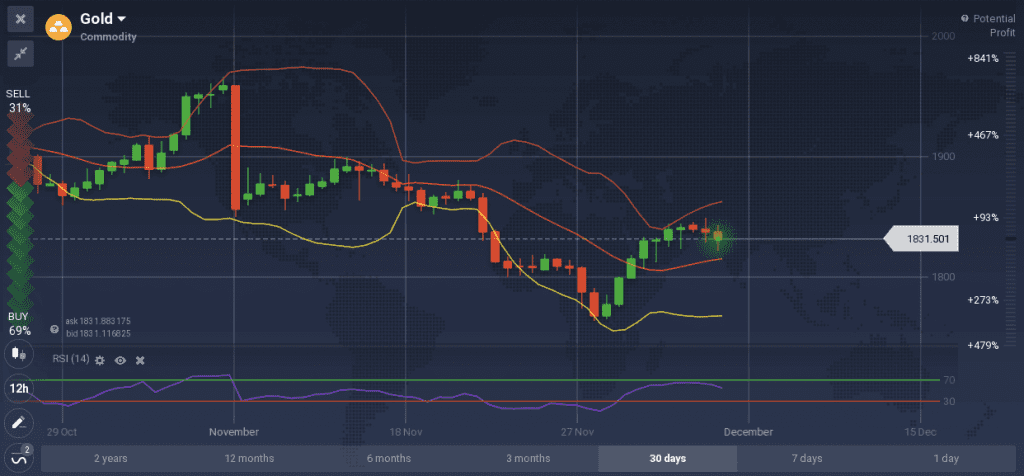
RSI demonstrates Gold moving away from the oversold level back to its average value, while the bands indicate a reversal, as the chart is bouncing off the upper band downwards. It looks like the price has been bouncing up and down, making small gains and then losing them and falling lower.
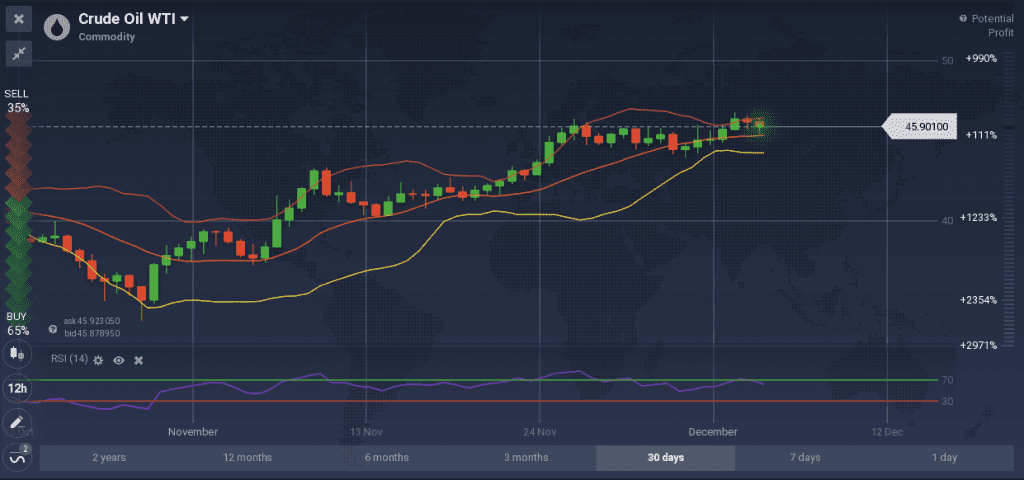
Crude Oil WTI gained $10 in the month of November, however, as a new series of lockdown is forced around the world, it started decreasing and is currently trading at $45.8. The indicators show a possible continuation of the downtrend.
What are your expectations for the month of December? How will the holidays affect the market? Share your opinion in the comments below!

