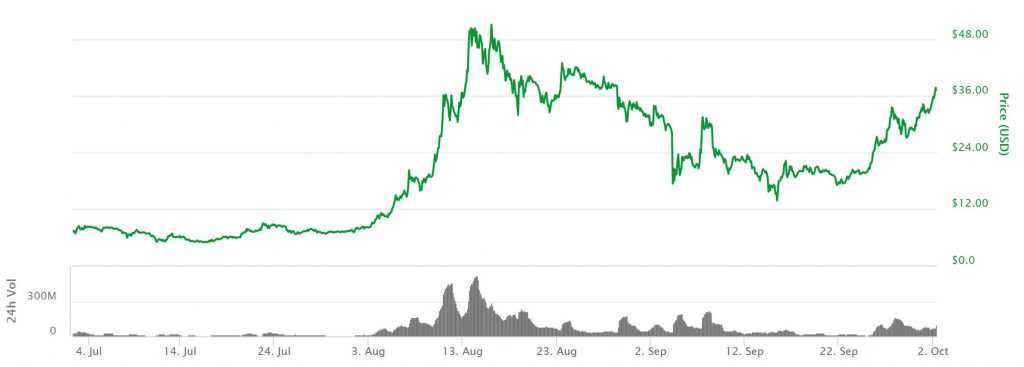
Launched in 2014 under a different name, NEO was mostly unknown until May 2017 when the price action started to demonstrate limited upward movement. In the period between June 15th and August 14th the coin appreciated over 2500%. On August 2nd this year, the world has seen the new, second version of NEO with enhanced functionality. As a result of the update, the coin price grew eight times in a matter of less than two weeks.

What is NEO and why you should take a closer look at this cryptocurrency? Dubbed the “Ethereum of China”, NEO has easily made its way to the list of top ten cryptocurrencies by market capitalization. At one point, the Huffington Post itself was hinting that sooner or later NEO can become the world’s largest cryptocurrency. Still on the humble eighth place, NEO is nonetheless an important part of the global cryptocurrency infrastructure and a coin with noticeable speculative potential. NEO is closer to traditional securities than cryptocurrencies, and acts like a share of a publicly traded company. NEO brings together fiat money and cryptocurrencies with the help of smart contracts, just like Ethereum network.
During the last two months, NEO has shown manifold behavior, growing and falling dramatically in a matter of days. It is currently the only cryptocurrency in the top-20 list to demonstrate 70% growth in a one-week retrospective. Qtum, with a market share of two and a half times less than NEO, is the second-best performer. The latter grew “only” 43 percent in a seven-day period.

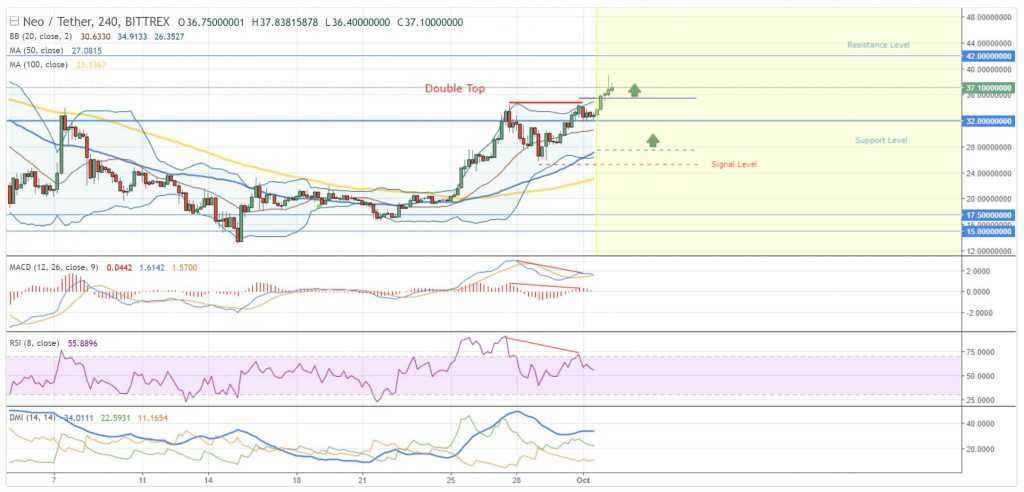
With huge volatility swings ravaging the NEO market, it is hard to predict the future price action. However, certain technical analysis tools and patterns can provide an insight into future behavior of the coin. Despite a two-week-long bullish rally, several trend reversal signals can be observed at the moment. Bearish divergence and double tops suggest possible negative movement in the foreseeable future. Simple Moving Averages with a period of 50 and 100, as well as MACD, confirm the upcoming negative trend. Should the price action reach the SMA50 and then head back up, the moment can be perceived as a buying opportunity. Should the price action successfully pass the SMA50 and continue its downward movement, the double top pattern will be confirmed. Support and resistance levels can be observed at $25 and $34. These points, therefore, should be followed precisely.

