
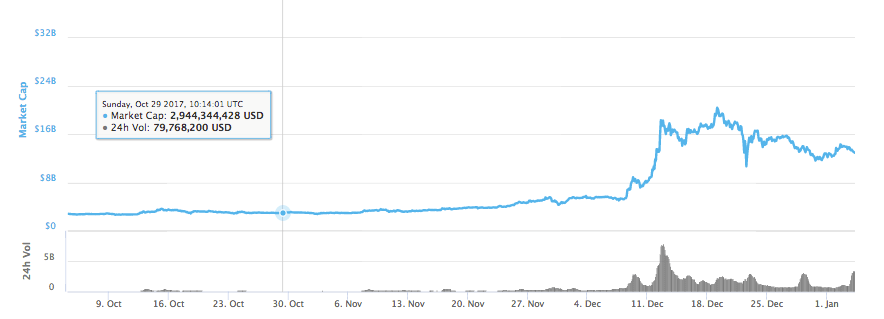
After the crazy gain a couple of weeks ago, Litecoin is becoming stable again. Because of the other constantly gaining coins, LTC currently slipped to be the 8th largest coin on the market. Yet, the coin holds over $12.9 billion in market cap. Trading volume is also good, as in the last 24 hours trading volume of above $3.4 billion was recorded.
Key Highlights
- After a price dip, LTC/USD pair began to recover until resistance at $255 pushed it down again
- LTC/BTC pair lost around 10.7 percent and currently trading around 0.0158 BTC
At the start of the week, the coin started to bleed and went down from $265 to $200, until it found support near $208. This support level was effective as it also initiated an upward journey for LTC/USD pair. With some minor resistances on the way, the coin continued its bullish rally. The pair finally reached $255 where it faced another stiff resistance. This resistance was strong enough to push the price down.

In the daily chart, the coin is on a downward rally as no prominent support level is present to hold the value. The pair lost almost 7 percent of its value and currently trading around $237.
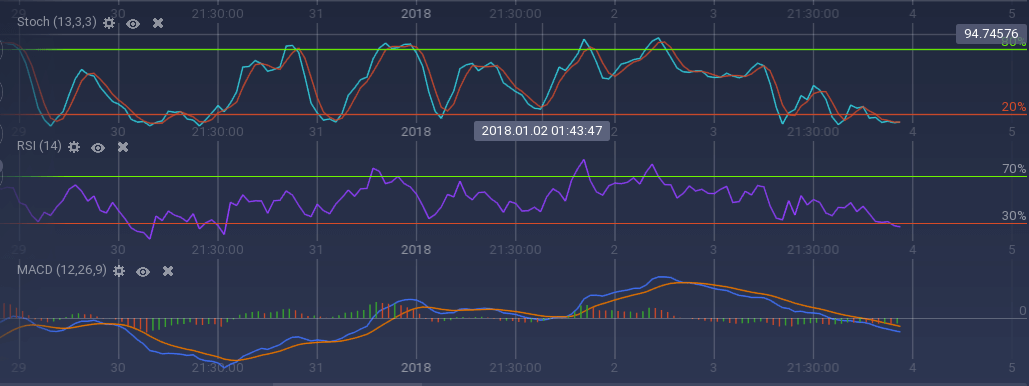
Because of the recent dip in the prices, the technical indicators went bearish. Stoch and RSI, both are running in the overselling zone. This is a good sign as it shows exhaustion among the buyers and a price recovery may follow. 100 SMA also went below the 200 SMA due to the price drop. The current Fibonacci retracement is at 38.2 percent.
Against BTC, LTC flowed a gradual depreciating course throughout the week. The pair went down from 0.0177 BTC to 0.0158 BTC over the week and thus losing around 10.7 percent.
