Ever wonder how well you’re really doing on IQ Option? IQ Option’s Performance Dashboard offers a powerful toolset to help traders track their performance, identify weaknesses, and optimize their trading behavior.
The Performance Dashboard functions as your personal analytics center, summarizing your activity, surfacing trends, and even suggesting tailored strategies to increase your win rate.
This article will walk you through everything you need to know about the IQ Option Performance Dashboard: how it works, what it shows, and how to interpret the data.
What Is the IQ Option Performance Dashboard?
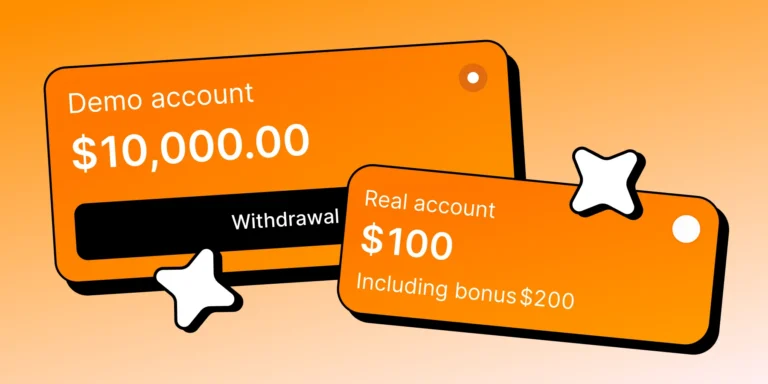
The Performance Dashboard is a built-in feature of the IQ Option platform that provides an overview of your trading activity, success rate, and market performance trends. It works across both demo and real accounts, motivating traders to stay active and improve their trading behavior with actionable feedback.
The dashboard is designed to:
- Display visual statistics about trading results
- Encourage more trading activity
- Reward high-performing traders
- Recommend improvements for underperforming users
- Help users track optimal trading windows and assets
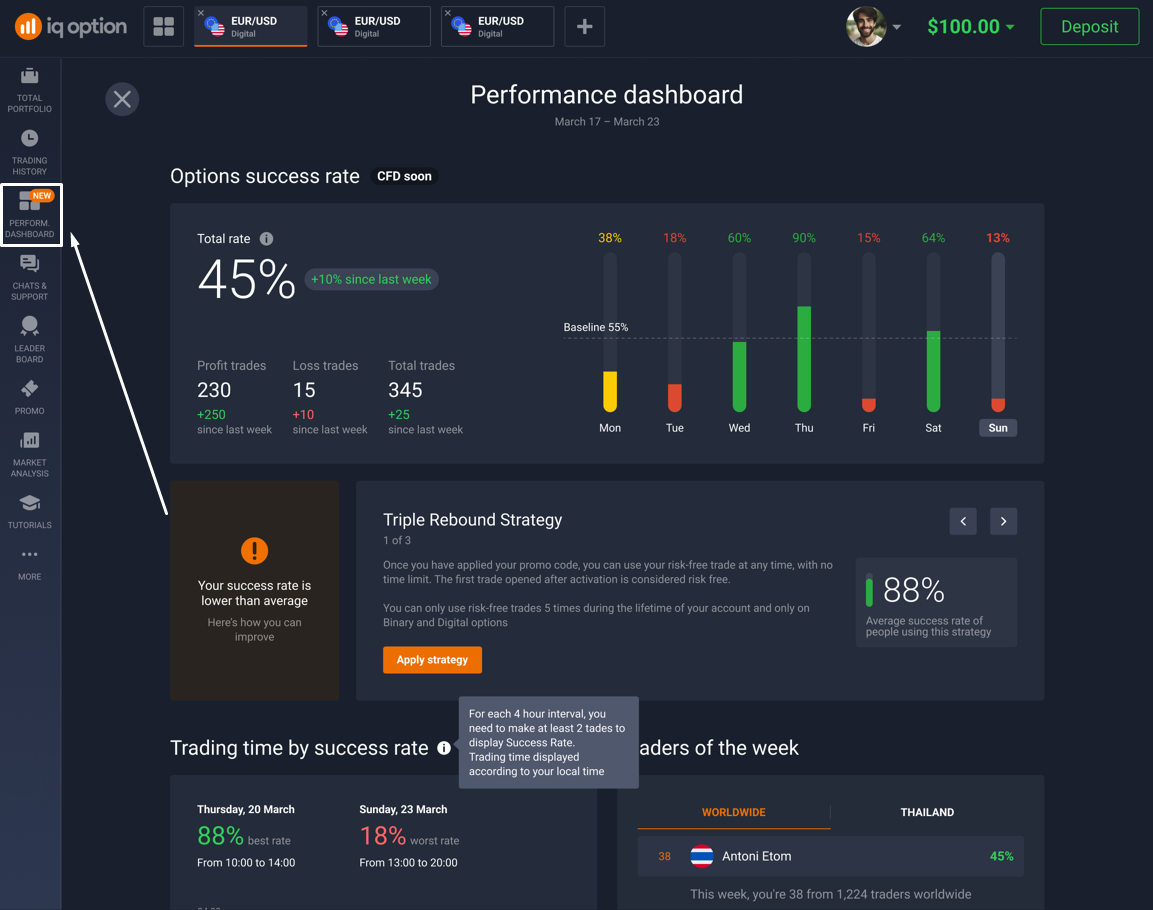
You can access it directly from the left-hand menu of the trading interface under “Performance Dashboard.”
Key Metrics Displayed in the Dashboard
Let’s break down each section and how you can use it:
- Success Rate
Your success rate is the percentage of winning trades out of all the trades you made. The formula is simple:
(Profitable Trades ÷ Total Trades) × 100
So if you placed 10 trades and 6 of them made money, your success rate would be 60%.
The number becomes available after you’ve made at least 5 trades — so the platform has enough data to work with.
What You’ll See on the Dashboard
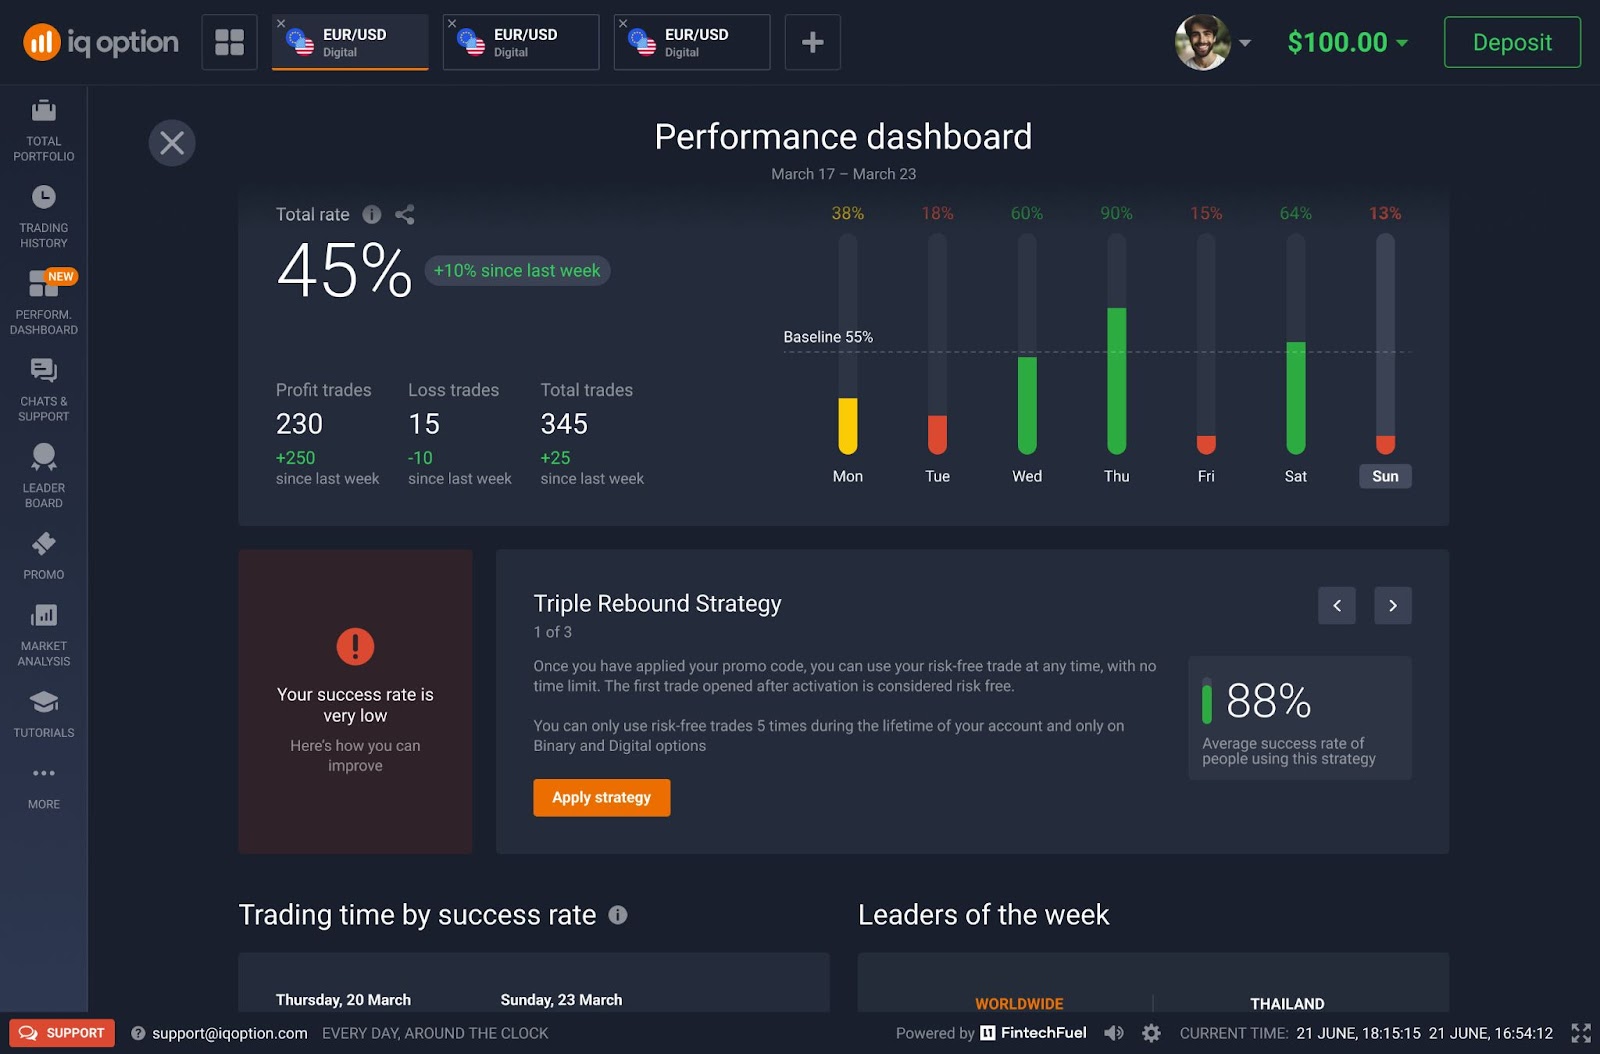
When you open your Performance Dashboard, here’s what the Success Rate section shows you:
- Total Rate: Your current success rate
- Change From Last Week: How much better or worse you’re doing compared to last week (example: +10%)
- Trade Breakdown:
- How many profitable trades you made
- How many ended in loss and in profit
- Your total number of trades
- Your improvement from the previous week in percentage
- Your success by day
What’s a “Good” Success Rate?
IQ Option uses a 55% success rate as the baseline. Here’s what that means:
- Above 55% = You’re on a good track! Keep doing what’s working.
- Below 55% = Might be time to tweak your strategy.
If you’re not there yet, the platform actually helps you get better. If your performance dips, it’ll suggest ready-made strategies you can apply. These strategies come with step-by-step instructions and are based on patterns that have worked for other users.
Why It’s Useful
- It gives you instant feedback on how you’re doing.
- You can track your progress week by week.
- It helps you spot patterns: Are you improving? Are your trades more successful on certain days?
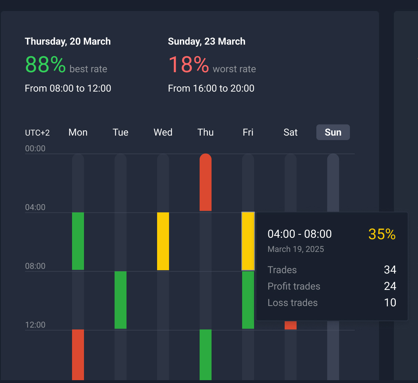
2. Trading Time by Success Rate
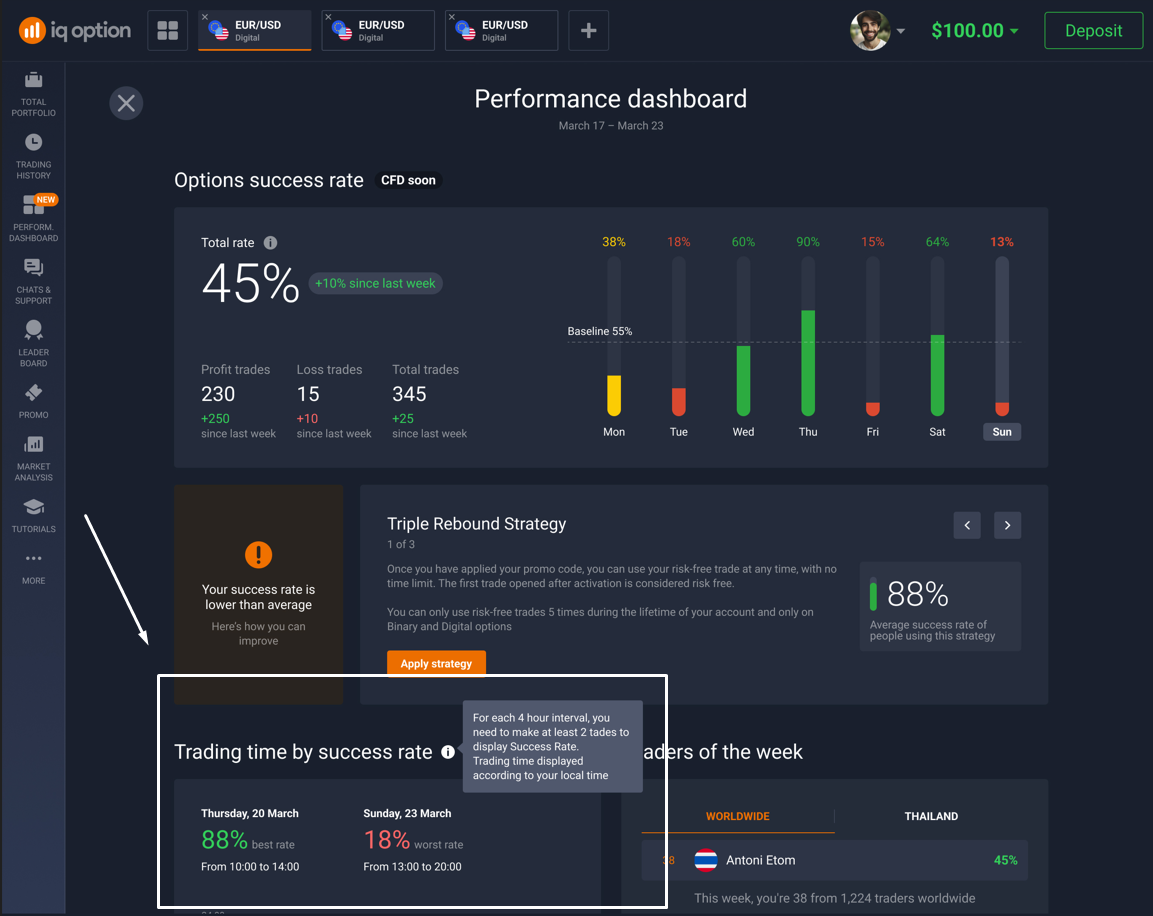
Ever feel like you trade better at certain times of the day? IQ Option actually tracks that for you — and shows it in your Performance Dashboard with a tool called Trading Time by Success Rate. It’s like having a zoomed-in view of your trading patterns.
How It Works
The day is split into 4-hour chunks, like:
- 00:00–04:00
- 04:00–08:00
- 08:00–12:00, and so on.
The platform looks at how many trades you made during each time block — but only if you made 2 or more trades in that slot.
Color Coding
🟩 Green = High win rate
🟨 Yellow = Average results
🟥 Red = Low win rate
It’s basically a heatmap of when you’re at your sharpest — and when you’re not.
For example, a trader consistently sees their best results on Thursdays between 08:00 and 12:00, with a win rate over 80%. But on Sundays from 16:00 to 20:00, their success rate drops below 20%. That’s a big gap — and definitely something worth noticing.
What Else You Can See
If you hover over each bar in the graph, you’ll get extra details like:
- Total number of trades
- Wins vs. losses
- Exact win percentage
Why It’s Useful
- You learn when you’re most profitable.
- It helps you plan your trading sessions smarter — especially if you’re short on time.
- You can adjust your routine to match your natural focus and rhythm.
- It’s a great tool for spotting hidden patterns — like if weekends are consistently bad for you.
✍️ Pro Tip: Don’t just trade whenever you feel like it — trade when you’re statistically better. This feature gives you the proof. Even just shifting your trades to better time blocks could make a big difference in your overall success.
3. Leaders of the Week
The Leaders of the Week section shows how you compare to other traders. It’s a weekly ranking of the top-performing traders on IQ Option — both globally and in your region.
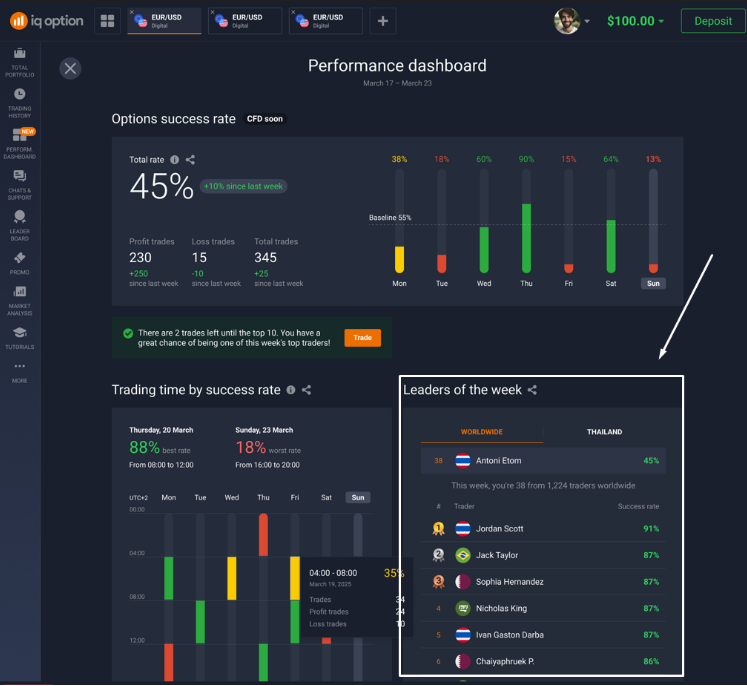
What You’ll See:
- The top 10 traders using real accounts
- Their win rates
- Your own rank among all traders that week
Why It’s Useful
- Get inspired by top performers
- See how far you are from making the leaderboard
- Push yourself to trade smarter and climb the ranks
4. Trades of the Week
This section highlights your best and worst trades, helping you learn from both success and failure.
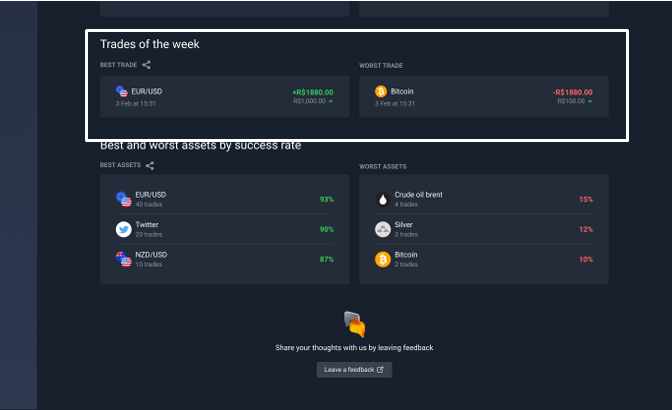
This side-by-side view helps you reflect:
- Were the conditions different?
- Was the asset too volatile?
- Did emotions affect decision-making?
✍️ Pro Tip: Use this info to review your journaled trade entries and spot what went right or wrong.
5. Best and Worst Assets by Success Rate
Traders often stick to their favorite assets. But are they really serving you?
This section ranks assets by their historical profitability.
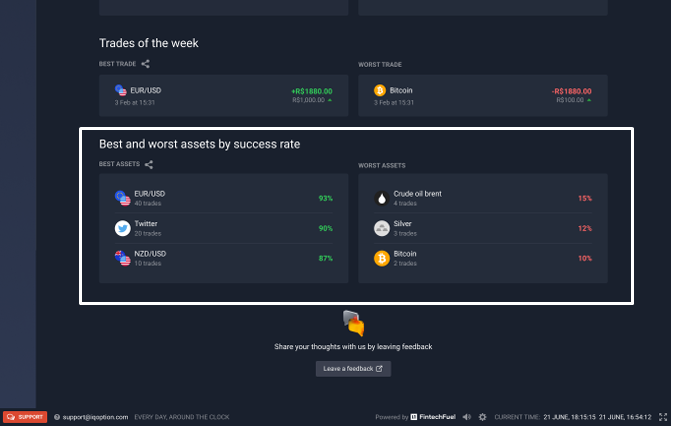
✍️ Pro Tip: Stick to assets you consistently perform well on and reduce exposure to high-volatility underperformers.
Strategy Suggestions: How the Dashboard Helps You Improve
If your success rate drops, the system will automatically recommend proven strategies to help you bounce back. These aren’t just random tips — they’re popular methods that have worked for other traders, and they come with clear instructions.
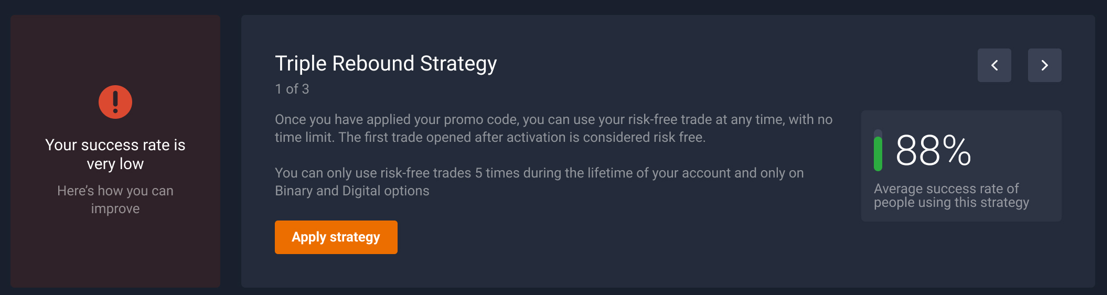
Some of these include risk-free trades, so you can test them out without pressure.
✍️ Pro Tip: Apply them during your best time slots, as identified in the “Trading Time” section.
Why the Performance Dashboard is a Game Changer
The dashboard adds actionable intelligence to your trading process, providing real-time analytics:
- Optimize trading hours for better performance
- Track improvement over time
- Recognize weak strategies and change them
- Apply success-proven strategies backed by IQ Option stats
- Get motivated by global leaderboard rankings
- Choose the most profitable assets to trade
Final Tips for Maximizing the Dashboard
Here’s how to make the most of it:
- Set Weekly Goals: Use your success rate as a benchmark.
- Journal Trades: Cross-reference dashboard insights with your trade journal.
- Experiment with Strategies: Especially if your success rate is declining.
- Review Weekly: Set aside time every Sunday to review your stats. The dashboard stores your historical data, so you can track changes and improvements over time.
- Monitor Top Assets: Watch for shifts in the “Best/Worst Assets” list.
Conclusion
IQ Option’s Performance Dashboard works as your digital trading coach that offers powerful insights that can transform your trading behavior.
With features like success rate tracking, time-based analytics, leaderboards, and strategic suggestions, the dashboard helps you build habits that lead to consistent results.
Head to your IQ Option Performance Dashboard now and turn your trading data into decisions that matter!
Frequently Asked Questions (FAQ)
- Why am I not seeing my trades reflected in the dashboard?
Right now, the Performance Dashboard only tracks trades made in Binary and Digital Options. If you’ve been trading other instruments like forex, crypto, or stocks, those won’t appear in your stats just yet.
- Why am I not showing up in the leaderboard?
The Leaders of the Week section only includes traders who are using real accounts. If you’re trading on a demo account, your results won’t be counted toward the rankings.
Once you switch to a real account, your performance will start showing up on the leaderboard — and you’ll have a chance to climb the ranks!
- How often does the dashboard update?
The dashboard updates every week, so you can track your progress over time and see how you’re improving (or what might need adjusting).
- Can I see data from previous weeks?
Yes! You can scroll back and view your past weekly stats to compare performance and spot long-term trends in your trading.
- What if I don’t have enough trades — will the dashboard still work?
Some features, like the success rate and time-of-day analysis, only unlock after you’ve made a minimum number of trades (usually 5+). If your dashboard looks empty, try trading a bit more to activate it.
