US Retail Sales produced a mixed bag of numbers that point to one thing, robust demand among American consumers. The headline figure came in at 0.1% which a bit shy of the expected 0.3% but the miss was made up with revisions to the previous month. The previous month was revised up 0.2% to 0.7% making up all the difference. On a year over year basis sales are up 6.6% as US labor markets improve, wages rise, and consumption increases.
The more important core figures, ex-auto and ex-autos & gas, were both better than expected. Core sales ex-autos rose 0.3% for the month and is up a stellar 7.3% YOY. The core sales ex-autos & gas is a little cooler, up 0.2% for the month and 5.9% for the year but are still good but show some deceleration from the previous month. The news was enough to strengthen the dollar, but traders should not read too much into it; it’s great for the economy but it does little to alter inflation outlook or FOMC expectation.
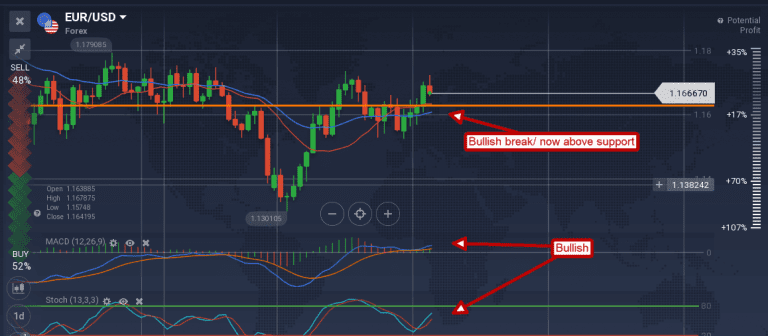
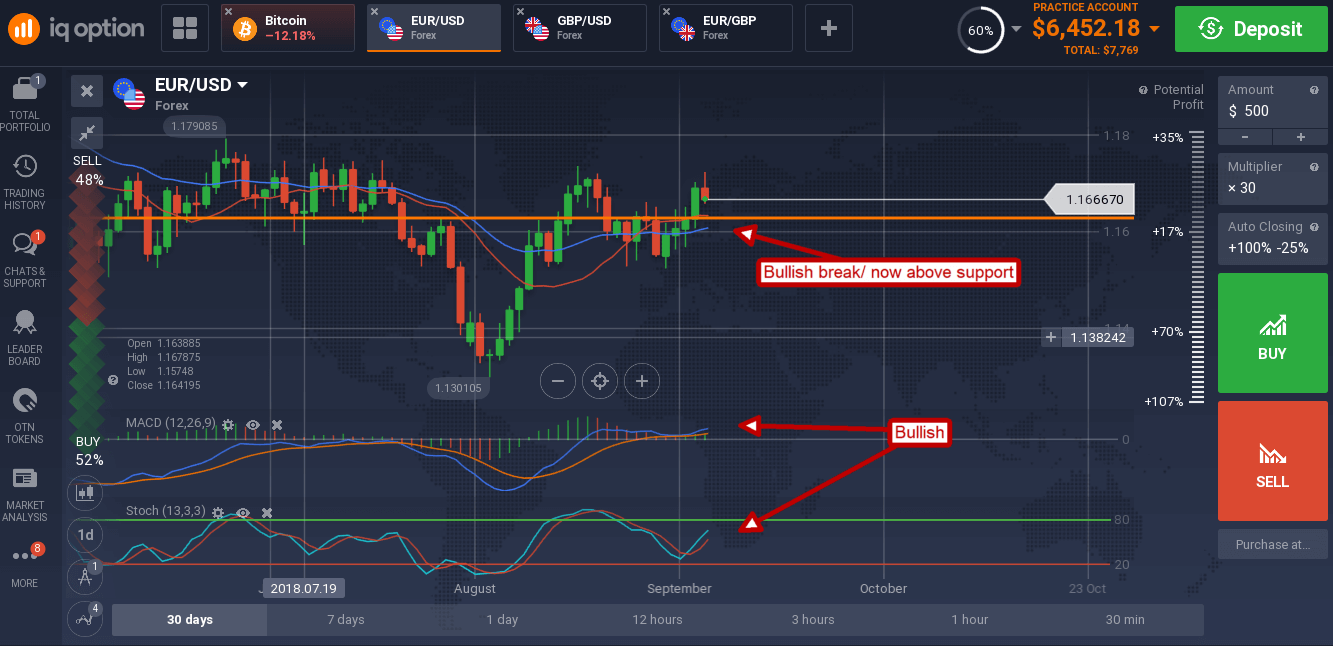
The EUR/USD fell hard on the news but was able to find support above the mid-point of Thursday’s candle during the early Friday session. The EUR/USD shot higher on Thursday as US inflation data came in weaker than expected and the ECB reaffirmed their semi-hawkish outlook. The ECB says they are firmly on track to hike rates next fall and that should keep the euro moving higher in the near-term and that is supported by the indicators. Both MACD and stochastic are pointing higher following a break above resistance that is consistent with upward movement in prices. A move down may touch the short-term moving average but that should be considered a buying opportunity.
The GBP/USD is also moving higher, supported by BOE rate hike outlook, but today’s move was hampered by the retail sales data. Regardless, Friday action was able to set a new high that is supported by the indicators.
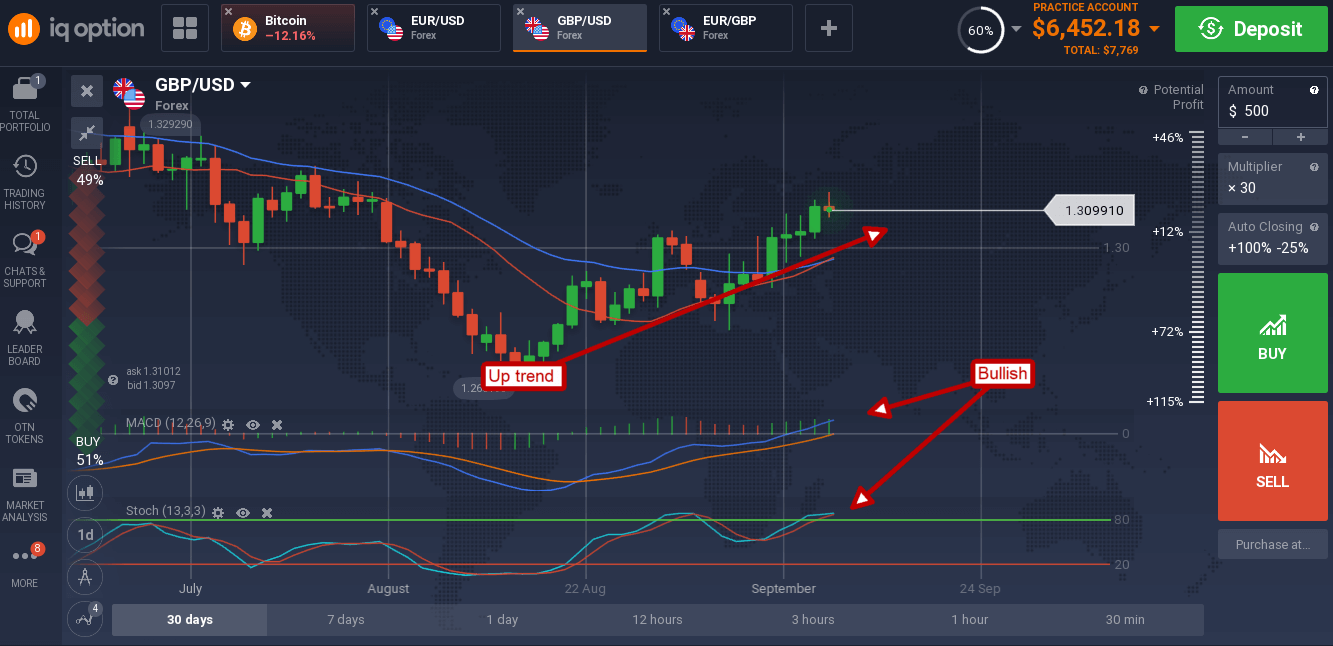
Both MACD and stochastic are pointing higher and showing some strength by trending near the high-end of their respective ranges. This pair may struggle with resistance near 1.3150, a move above that would be bullish.
