Digital options are like the more sophisticated, lesser-known cousin of binary options. They keep the straightforward mechanics but throw in an extra layer of complexity for potentially higher rewards.
In this article, we’ll dive into what digital options are, explore the types available on IQ Option, guide you on how to trade them, share tips for beginners and strategies.
What are Digital Options?
Digital options are a great tool for quick trades with added complexity and profitability. Unlike the win-or-lose outcomes of binary options, digital options offer a spectrum of results based on the price movement of the underlying asset. Your payout isn’t fixed; it depends on how far the asset’s price moves from your strike price at expiration. The bigger the move, the bigger your reward.
Binary options vs. Digital options
Imagine you’re watching a high-stakes race with a friend. Your friend bets on the winner, while you’re betting on how much faster or slower each competitor will be compared to a benchmark. This is how binary options stand against digital options.
Both binary and digital options fall under the category of derivatives — financial instruments whose value is tied to an underlying asset. This means that when you buy or sell an option, you’re not actually getting the asset itself. Instead, you’re deciding on whether its price will rise or fall over a specific period. Once the option expires, the deal closes automatically, and you either score a profit or lose the investment.
Let’s dive into how these two types of options differ:
| Binary Options | Digital Options | |
| Events that determine the outcome | Only the direction of the price — up or down | The direction of the price + how far it moves from the strike price |
| Potential profitability | Up to 95% | Up to 900% |
| Expirations | From 1 minute to 1 month | 1, 5, 15 minutes |
| Risk-reward | You can’t lose more than your investment amount or win more than the preset % | Your losses can exceed your initial investment — just like your profit could |
Digital Options glossary
To effectively trade digital options, it’s crucial to get familiar with the key terms.
Strike price
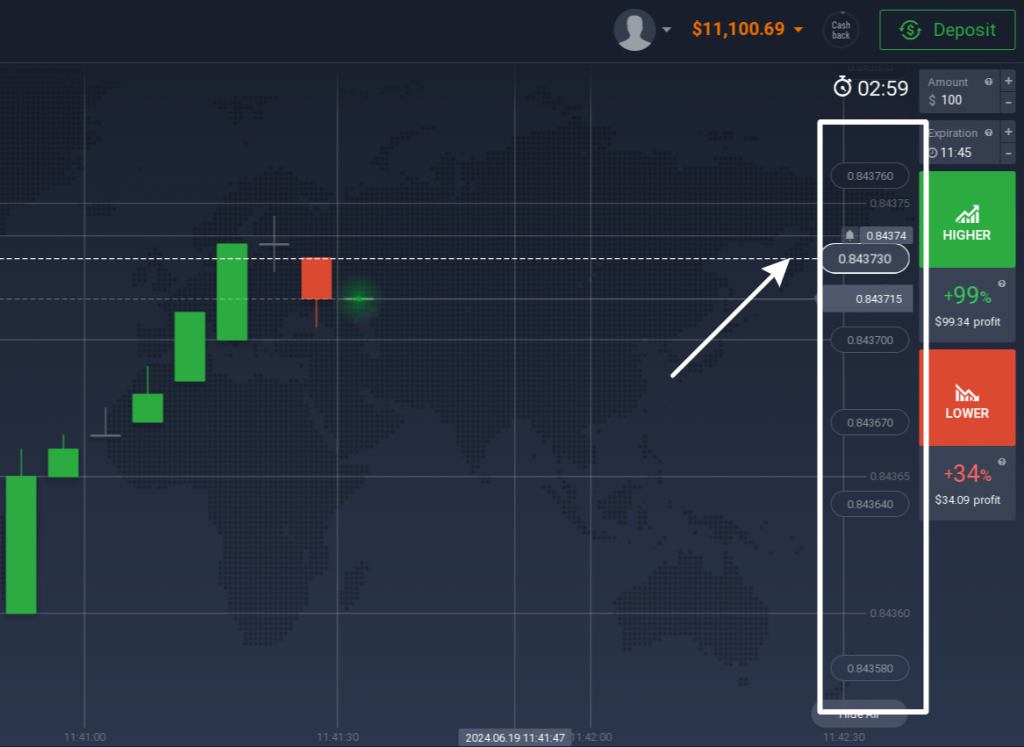
The strike price is the target level that the closing price needs to exceed (for Higher options) or fall below (for Lower options) for your trade to be profitable.
On the chart, strike price levels appear as white boxes on the right side of the screen. Hover over them to see how the expected profit percentage changes. The lower the probability of the price hitting the chosen strike level, the higher the potential profitability.
Expiration time
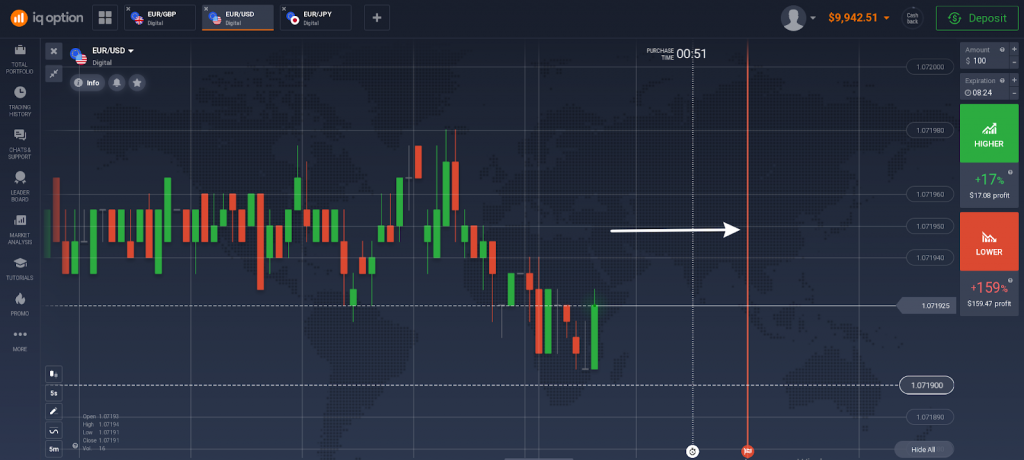
Your trade will be closed automatically at the selected time. At IQ Option, digital options can last from 1 minute to 15 minutes. The expiration time is indicated on the chart as a red line.
Payout offer
This is the profit you will earn if your prediction is correct.
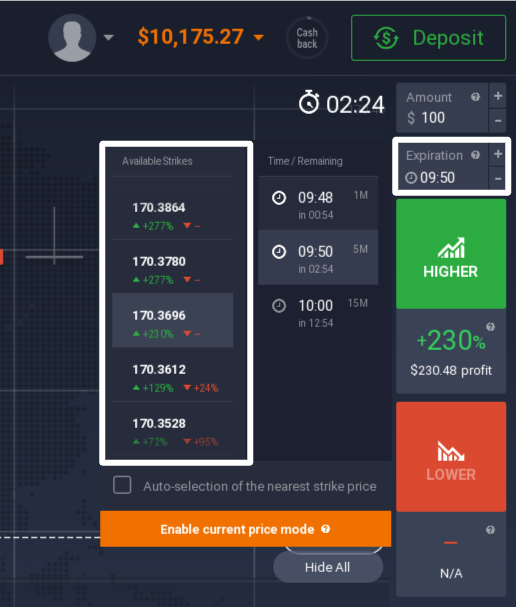
The profitability percentage varies based on the strike price and can be viewed in the Expiration section.
Purchase deadline
A dotted white line on the chart marks the time until which you can buy options. Before this deadline, you can purchase as many options of the same asset as you want, in any direction and at any strike levels.
Call Option
Also known as a “Higher” or bullish option, a Call option will result in a profit if the closing price is higher than the strike price.
Put Option
In other words, a “Lower” or bearish option. It will result in a profit if the closing price is lower than the strike price.
Types of Digital Options on IQ Option
IQ Option offers a variety of assets in the Digital Options category, including currency pairs, indices, gold, and OTC (over-the-counter) assets that you can trade during weekends when other markets are closed.
- Currency pairs:
| EUR/USD | EUR/JPY |
| GBP/USD | GBP/JPY |
| EUR/GBP | USD/CAD |
| AUD/USD | AUD/CAD |
| AUD/JPY | USD/CHF |
- Indices, ETFs, commodities
| USD Currency Index | US 30 |
| US 500 | Gold |
| US 100 |
- OTC Options
| US 500 | AUS 200 |
| US 100 | GER 30 |
| US 30 | SP 35 |
| EU 50 | JP 225 |
| UK 100 | HK 33 |
| FR 40 |
How to trade Digital Options on IQ Option
Let’s cover the main steps of opening and closing a digital options trade on the platform.
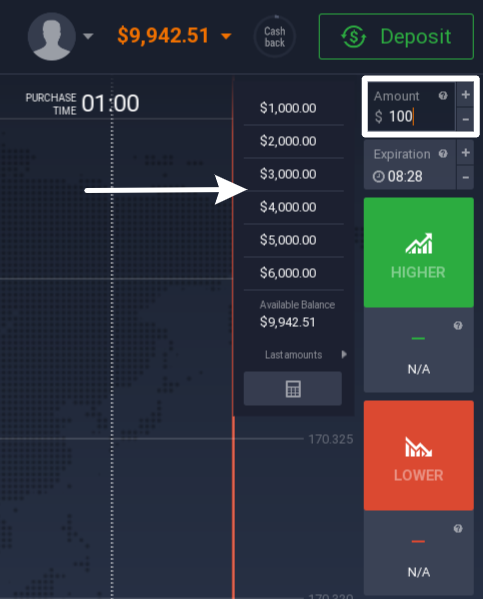
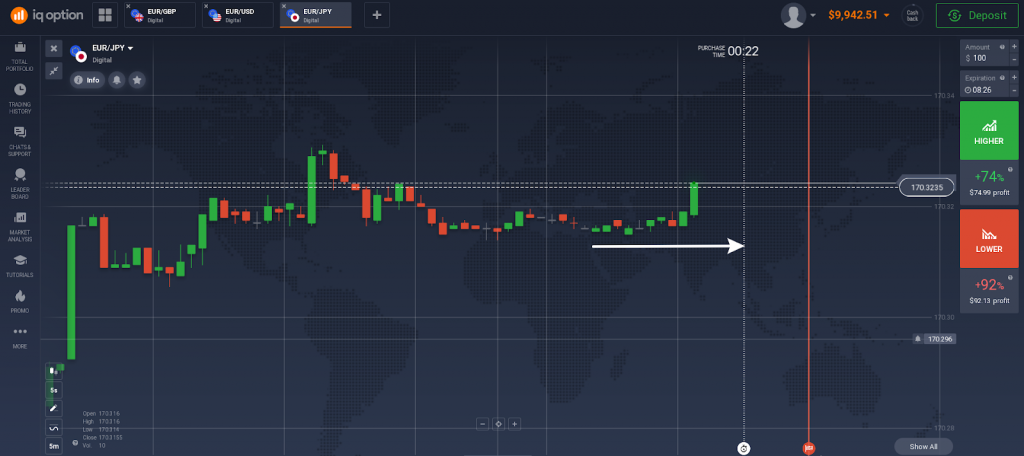
1. Enter the amount you want to invest in the ‘Amount’ section on the right side of the screen.
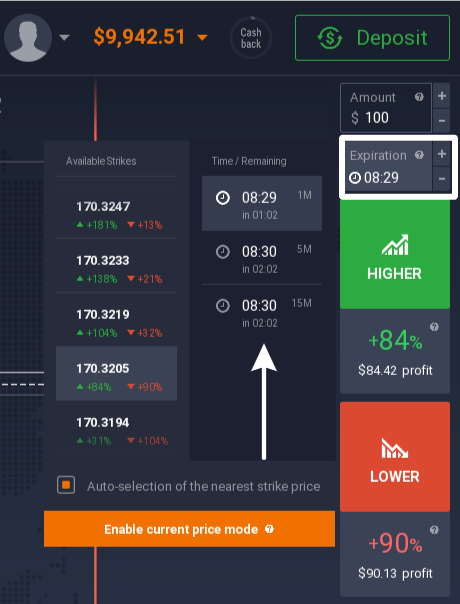
2. Set the expiration time: 1, 5, or 15 minutes.
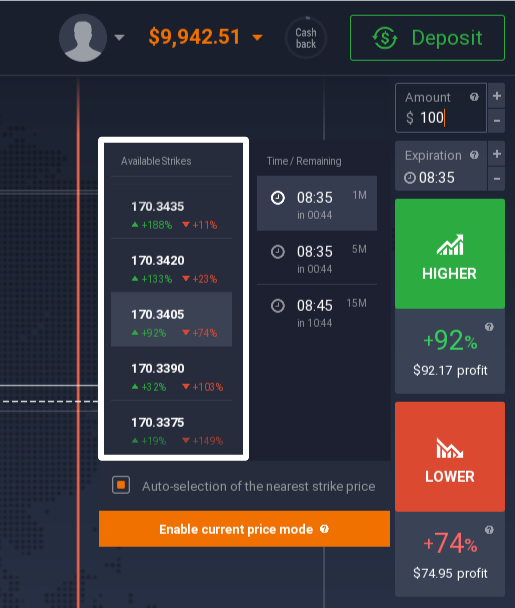
3. Select the strike price from the Expiration section. You can choose it manually or enable auto-selection of the nearest strike price.
4. Analyze the price movement using indicators and digital options strategies.
5. Select the direction of the price change: Higher or Lower, before the chart reaches the purchase deadline.
6. While waiting for the trade result, you can open additional deals without needing to wait for the first one to close.
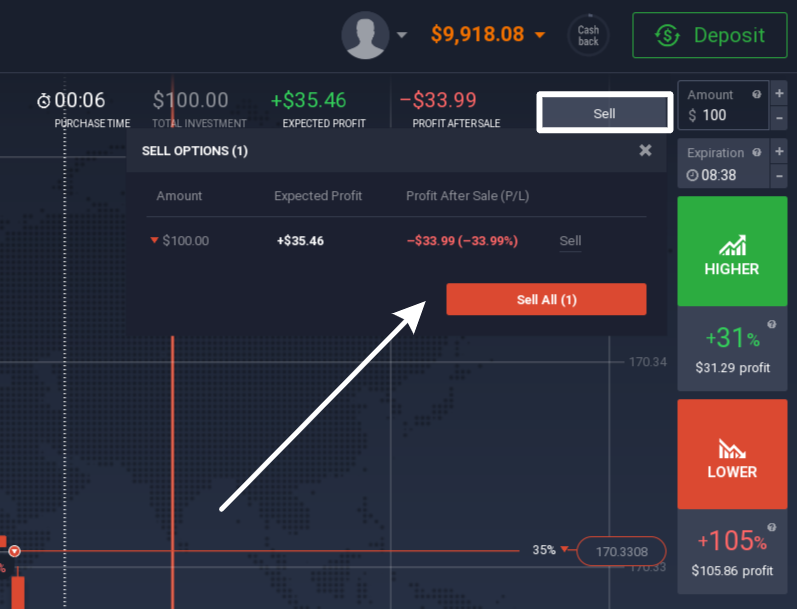
7. If your trade is not going as planned, you can manually close it before it expires to limit your losses. To do this, click the Sell button in the upper right, or go to ‘Show Positions’ in the bottom right and select your option from the list.
Digital Options trading strategies
Digital and binary options are quite similar, so any favourite strategies you use for binary options will work for digital options too.
Here are a few examples of digital options trading strategies you might like.
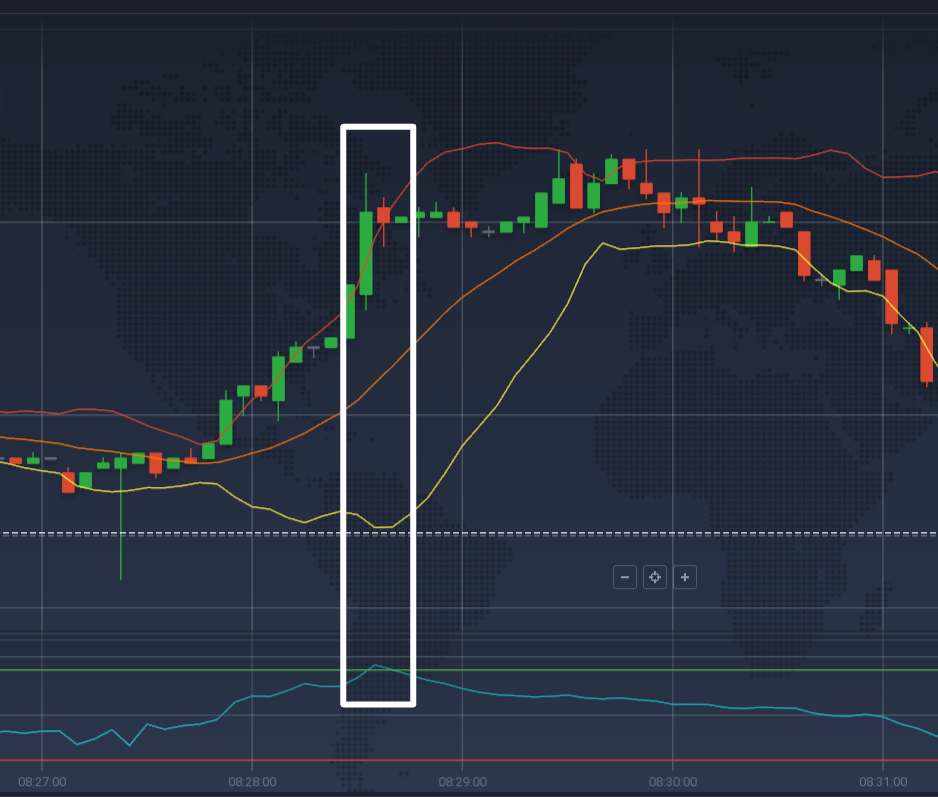
1. CCI + Bollinger Bands
Ideal for a 15-minute option, this strategy excels at identifying peak asset values — both highs and lows — to optimize trade timing.
How to use:
1. Navigate to the ‘Indicators’ section found in the bottom-left menu. Apply two indicators with the following settings:
| CCI | Bollinger Bands |
| Period: 40 Overbought / oversold levels: +300/-300 | Period: 14 Deviation: 2 |
2. Set the chart to the 5-minute timeframe.
3. Wait for the CCI to breach the overbought or oversold levels.
4. Seek confirmation from the Bollinger Bands: watch for a candle closing beyond the upper or lower band lines.
5. Open a trade.
☝️
Opt for a Call option if the CCI breaks the -300 level and the candle closes below the lower Bollinger Band.
In the example below, a green candle surpasses the upper Bollinger Band, succeeded by a red candle — a signal to initiate a bearish trade. Simultaneously, the CCI surpasses the +300 mark, reinforcing the bearish sentiment.
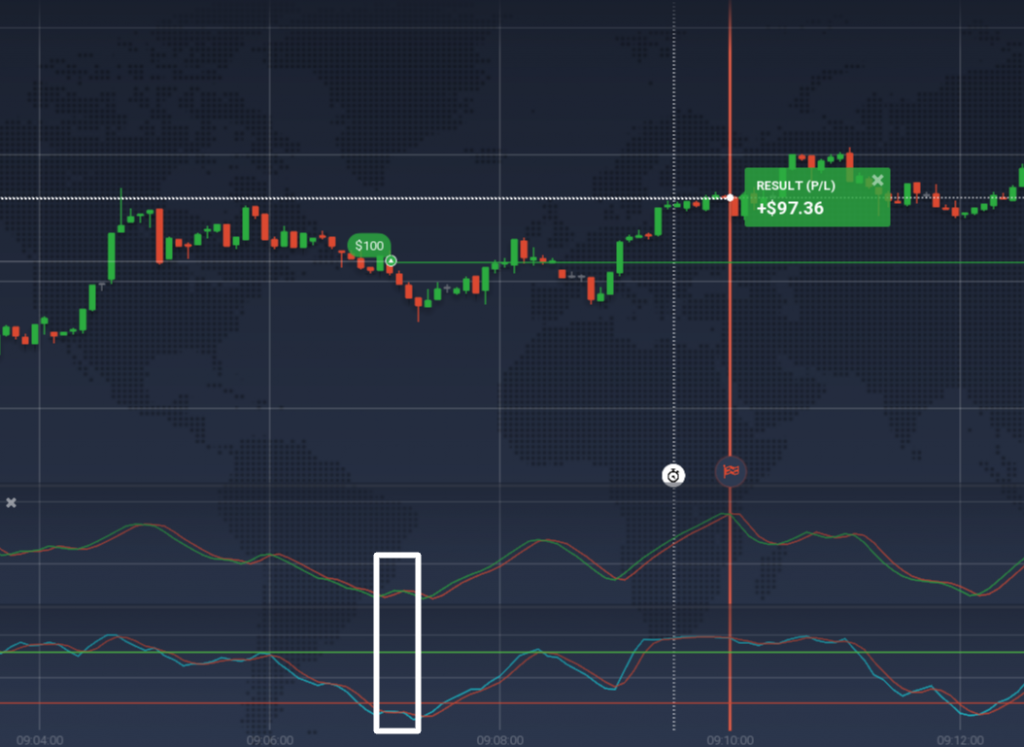
2. Ehler’s Fisher Transform + Stochastic
Like the previous strategy, this approach identifies trend reversals for effective trading.
How to use:
1. Go to the ‘Indicators’ section apply 2 indicators with the following settings:
| Ehler’s Fisher Transform | Stochastic Oscillator |
| Period: 10 | Period K: 20 Smoothing: 3 Period D: 3 |
2. Set the chart to the 5-minute timeframe.
3. Monitor the Fisher Transform lines, acting when they cross at +2000 or -2000.
4. Seek confirmation from the Stochastic indicator, observing when its lines cross below 20 or above 80.
5. Enter a trade.
☝️
Consider choosing a Call option if the Fisher Transform lines cross below -2000 and the Stochastic lines cross below 20.
Given that digital options trading involves predicting both the price direction and its range, exploring a swing trading strategy could be beneficial. While typically suited for longer timeframes, this approach enhances your ability to gauge market swings accurately.
Digital Options tips for beginners
Be rational
When you see potential profits of 200-300% or more, the temptation to take a risk is hard to resist. But remember: the higher the yield, the slimmer the odds that the price will hit that level before the option expires. Reserve those high-yield strike levels for when your technical analysis gives you strong signals that the risk is worth it.
Stick to your risk management
There are 2 main approaches to risk management:
- Conservative: Limit your risk to no more than 2% of your balance per trade.
- Aggressive: Allocate up to 5% of your balance per trade.
Test on Demo
To discover a reliable digital options strategy, aim to test at least a dozen strategies. Understanding their effectiveness often requires closing approximately 20 trades with each strategy.
A demo account offers a risk-free environment for testing strategies. Once you identify a strategy that aligns with your goals, consider transitioning to a real account for actual trading.
Conclusion
Digital options are a sibling of binary options, offering a broader range of outcomes and potentially higher rewards. Armed with the right strategies and a solid understanding of key concepts, you can make profits up to 900% in just 1–15 minutes.
