Turkey’s autocratic leader Erdogan is at odds with US President Donald Trump. Erdogan’s administration has been holding a US pastor in detention since 2016 claiming he helped incite political unrest that led to the 2016 coup attempt. Attempts to bring the situation to a peaceful conclusion have ended without success leaving Trump little choice but to threaten sanctions. The news rocked an already unstable Turkish economy sending the Turkish Lira to new lows versus the dollar.

While the issue is centered firmly in Turkey it does have wide ranging effects. Banks within the EU have broad exposure to Turkey and the lira due to close economic ties that have been maintained since the late 1950’s. This exposure has caused concern within the ECB that a weakening lira could negatively impact major EU banks like BNP Paribas, Unicredit and Spain’s BVA.
The Turkish Lira shed more than 10% on the news Erdogan was going to “stand up” to US economic pressure. The USD/TRY created a long green candle moving up to extend a long-term rally and set a high never seen before. The indicators are strongly bullish showing extreme peaks in MACD momentum on the daily, weekly and monthly charts. Without some new development it looks like the TRY will continue to fall.
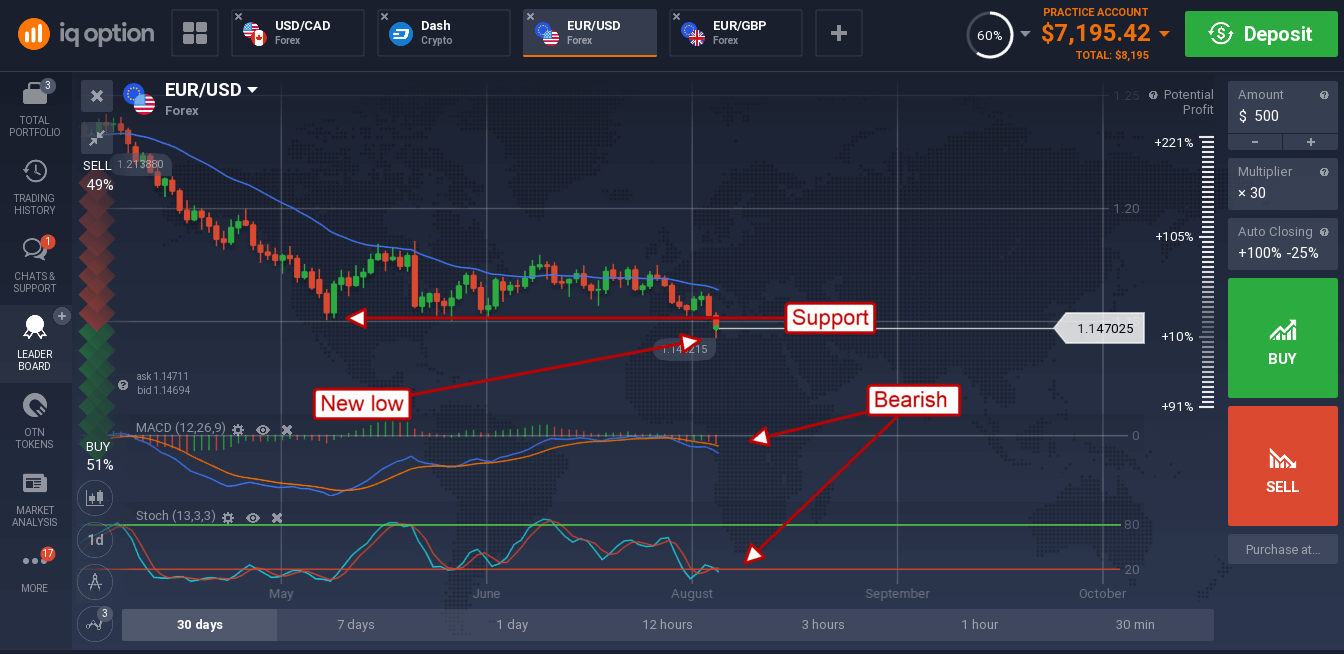
The real damage was done to the euro. The euro fell on the heels on Turkish woe shedding more than a half percent as fallout threatens to derail the EU economy. The EUR/USD moved down to break below my support target at 1.1525 and confirm down trend. The pair has now broken out of a flat-bottomed triangle to the downside and is heading lower. This move is aided by strong US inflation data showing sustained acceleration in PPI and CPI over the past year. Now that support has been broken a move to 1.12500 is likely.

The Euro also fell hard against the British pound but Brexit inspired weakness in the pound limited the fall. The pair is now forming a peak at a ten-month high and confirming resistance at this level. The indicators are consistent with this peak but do not yet indicate reversal.

A move sideways within a new range is likely with support at 0.89500 and resistance near 0.90200.

