The EU’s single currency fell versus a wide range of global currencies in Friday trading. Forex traders have turned their eye to next week’s ECB policy meeting and expectations for possible policy tightening. While no one is expecting the bank to end asset purchases or raise interest rates there has been some anticipation for another incremental change to the statement. Such a change would eventually lead to policy change, higher interest rates, but those expectations were dimmed with Friday’s economic data.
Friday’s data was limited to Germany, the pillar of EU economics, and focused on inflation; the German Producer Price Index. German PPI came in at 0.1% MoM and 1.9% YoY, both positive and both consistent with economic expansion. The problem is that both are below expectation and continue the trend of slowing economic expansion which began over the winter months. With inflation trending below target and on the decline the ECB will have no reason or need to make changes.
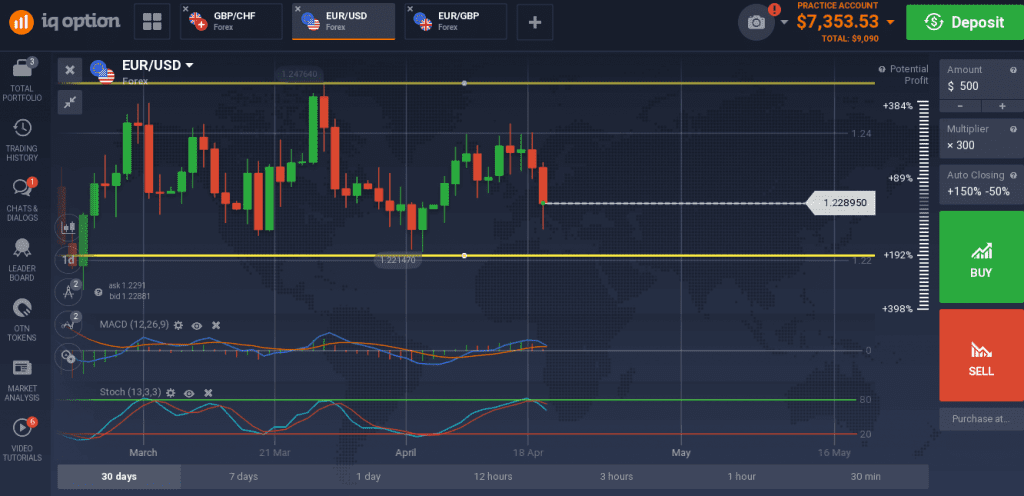
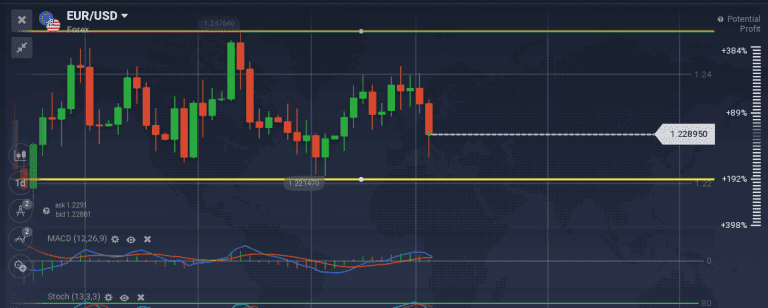
The EUR/USD fell nearly 100 pips in the wake of the PPI news, extending a fall from resistance which began in the previous day’s session. The caveat is that the pair remains range bound and is likely to remain so into the foreseeable future. The range has been dominating the pair for more than three months and driven by shifting central bank policy. The risk is twofold. The ECB could sound hawkish or some other data could emerge to drive the pair higher, not likely, or the bank could backpedal, return to its less optimistic stance and send the pair crashing through support. Support is near 1.2200, a break of which would be very bearish.

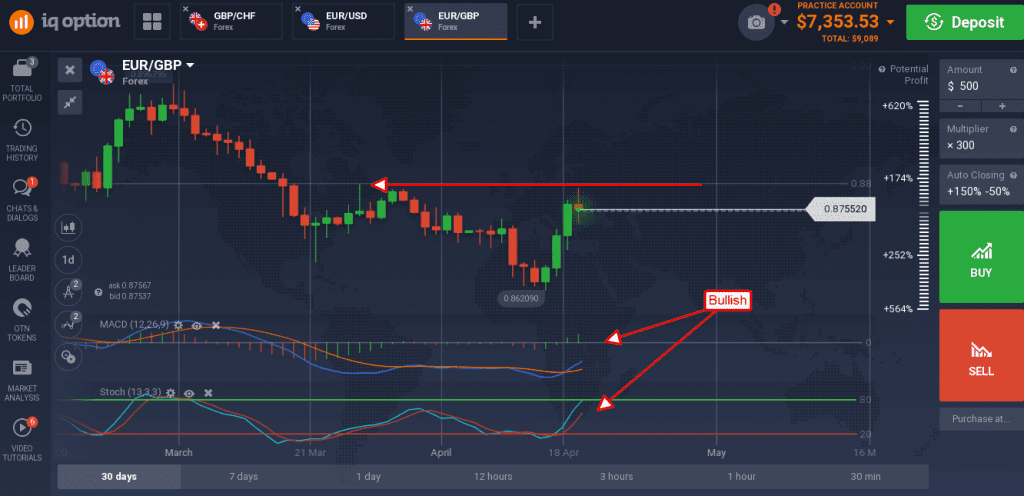
The euro tried to extend a rally versus the British pound, but the gains were capped by resistance. The pair formed a small sized red bodied candle with long upper shadow, very doji like, confirming resistance near the bottom of a recently broken trading range. Resistance is between 0.8700 and 0.8800, a range that may trap price over the next few trading days. The indicators are bullish and may lead to another test of resistance, a break of which would be bullish. The risk is UK data, data that has been coming in below expectations but well above the 2% BoE inflation target, and expectation the BoE will raise interest rates at their meeting in a few weeks.

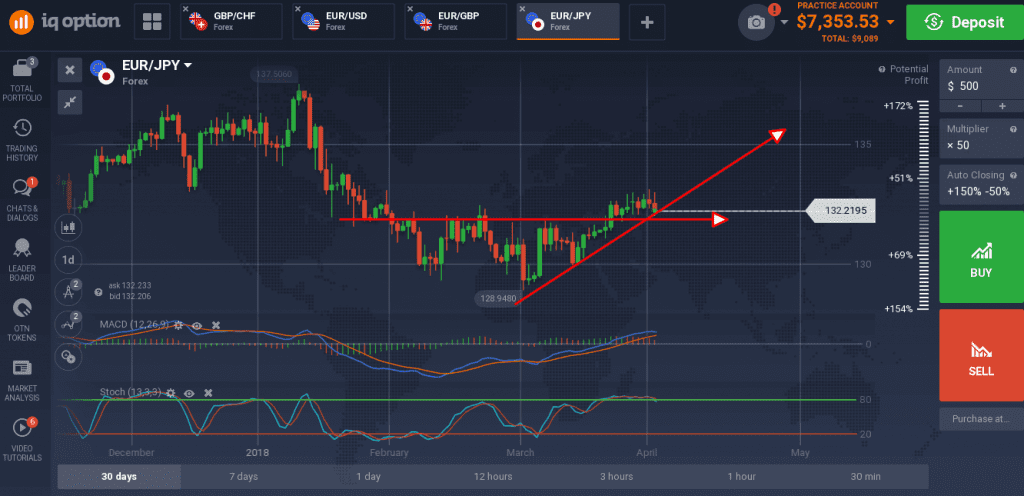
The euro halted its climb against the Japanese yen, but the pair may be setting up for a bigger move higher. It is sitting on support just above the short term moving average, support that is consistent with the neckline of a head & shoulders reversal pattern so likely to be strong.

The indicators are both rolling over in confirmation of resistance but are also setting up for trend confirming crossovers should a bounce occur. Support is at 132.20, a break of which would be bearish.

