The trading week for August 20-25 started with a large sell-off for the US Dollar and it was not any fundamental or economic news but comments from the US President. Many times, what moves the forex market is not news or economic events or data but statements and investors sentiment. We quote the following statements from US President Trump taken from CNBC.
“Trump says he will keep criticizing Fed if it continues to raise interest rates. “
President Donald Trump said he disagreed with the Federal Reserve’s decision to raise interest rates, and he said the Fed should do “what’s good for the country,” according to an interview with Reuters. Trump told Reuters that he was “not thrilled” with Fed Chair Jerome Powell for raising rates. Asked whether the Fed should be more accommodating, he said, “I should be given some help by the Fed.” The president said he would criticize the Fed if it continues to raise rates.
“I’m not thrilled with his raising of interest rates, no. I’m not thrilled,” Trump said in the interview. The president also said China is manipulating its currency and the Europeans are manipulating the euro, Reuters reported Monday.” Source: CNBC.
Back to the economic calendar today the forex market will weigh on the US President comments expected Fed Chair Jerome Powell to be a “cheap money man” but there is important economic data to be released. There is the Westpac Leading Index for Australia, the All Industry Activity Index for Japan, the Retail Sales in Canada, the US Existing Home Sales and the weekly US Crude Oil Inventories and the much anticipated FOMC Meeting Minutes which can move the US Dollar and provide support if they appear to be hawkish on the economy and the future interest rate path.
These are the key economic events in the forex market today, time is GMT:
American Session
Canada: Retail Sales MoM, Retail Sales ex Autos MoM, US: Existing Home Sales MoM, Existing Home Sales Change, EIA Crude Oil Stocks Change, FOMC Minutes
Time: 12:30, 14:00, 14:30, 18:00
The Retail Sales measure the change in the total value of inflation-adjusted sales at the retail level. It is the foremost indicator of consumer spending, which accounts for most overall economic activity, showing the performance of the retail sector in the short term. Higher than expected readings are considered positive for the Canadian Dollar with positive effects on the future economic growth measured by the GDP level.
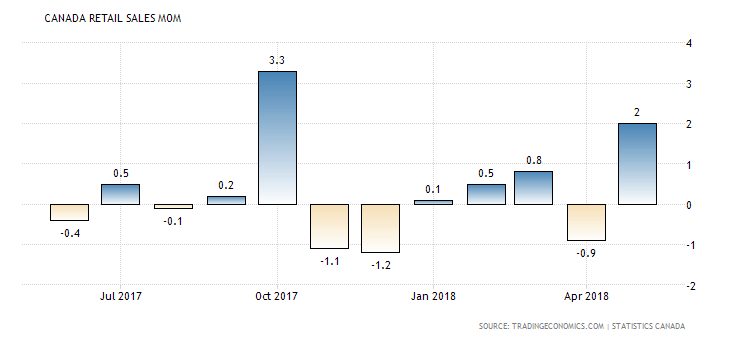
“Retail Sales in Canada increased 2.0 percent month-over-month in May of 2018, following a downwardly revised 0.9 percent decline in April and above market expectations of 1.1 percent. Sales of motor vehicle and parts dealers rebounded (3.7 percent from -3.8 percent in April) and sales of receipts at gasoline stations rose for the second consecutive month (4.3 percent), mostly due to higher prices at the pump. Also, sales advanced for general merchandise stores (3.2 percent); building material and garden equipment and supplies dealers (5.4 percent) and clothing and clothing accessories stores (2.8 percent). Meanwhile, sales of food and beverage stores fell (-2.1 percent), mainly due to lower sales at supermarkets and other grocery stores (-3.1 percent). Year-on-year, retail trade went up 3.6 percent.”, Source: Trading Economics.

The Retail Sales in Canada are highly volatile as seen from the above chart with an undefined trend for the past 12-months. The monthly Retail Sales in Canada are expected to decrease to 0.1% from the previous figure 2.0% and the monthly Retail Sales ex Autos are expected to decrease to -0.1% from the previous reading of 1.4%.
The US Existing Home Sales provide information on the current housing market conditions. The housing market is considered as a very sensitive factor to the US economy which can often predict turning points in the business and economic cycles. Higher than expected readings are positive for the US Dollar.
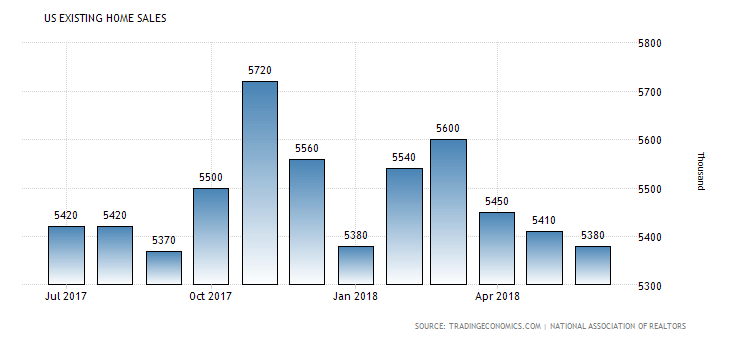
“Sales of previously owned houses in the US declined 0.6 percent month-over-month to a seasonally adjusted annual rate of 5.38 million in June of 2018 from a drownwardly revised 5.41 million in May. It compares with market expectations of a 0.5 percent rise to 5.44 million. It is the third straight fall and the lowest rate in five months. The median house price increased to an all-time high of $276,900 from $265,100 in May and the months’ worth of supply edged up to 4.3 from 4.1. In addition, the number of houses available in the market increased to 1.95 million from 1.87 million in May. Year-on-year, existing home sales fell 2.2 percent.”, Source: Trading Economics.

As seen from the above chart the US Existing Home Sales have peaked in March of 2018 and have decreased for the past three consecutive months. The forecast is for the US Existing Home Sales to increase to 5.40M from 5.38M, an increase of 0.6% compared to the previous decline of -0.6%.
The EIA Crude Oil stockpiles report is a weekly measure of the change in the number of barrels in stock of crude oil held by US firms. If the increase in crude inventories is more than expected, this implies a weaker than expected demand and is considered negative for crude oil prices. The same applies if a decline in inventories is less than expected.
The most important key event for the day which can form a new trend and strengthen the US Dollar versus other currencies with the latest sell-off due to the statements by the US President FOMC or even continue its short-term depreciation is the release of the stands for The Federal Open Market Committee (FOMC) Minutes which provide important information on economic and financial conditions, and determines the appropriate stance of monetary policy, evaluating the risks to its long-run goals of price stability and sustainable economic growth, while they can also signal the future US interest rate policy. The forex market will weigh on the statements on economic conditions and the monetary policy to determine the odds of further interest rate hikes by the Fed in 2018, with most odds being for one or two more interest rate increases., with a potential interest rate increase next month.
Pacific Session
Australia: Construction Work Done QoQ Q2, Westpac Leading Index MoM, RBA Assistant Governor Debelle Speech
Time: 00:30, 01:30, 03:10
The Westpac Leading Index tracks economic activity, including various indicators to provide an indication of how the economy will perform. Higher than expected readings for the Westpac leading Index and the Construction Work Done are considered positive and supportive for the Australian Dollar, indicating a robust construction sector and economy.
Asian Session
Japan: All Industry Activity Index MoM
Time: 04:30
The All Industry Activity Index measures the monthly change in overall production by all industries of the Japanese economy. Higher than expected figures are considered positive for the Japanese Yen reflecting overall growth figures and economic expansion. The forecast is for a monthly decrease to -0.7% from the previous reading of 0.1%.

