The dollar is trapped in a tight range as market watchers weigh FOMC outlook against global growth prospects, and this week’s data could be the trigger to break it free. Now, to be clear, there is not a lot of data due this week from the US or abroad but what there is will shed new light on prices. Thursday traders will be on the lookout for the US Producer Price Index and on Friday the Consumer Price Index.
Producer prices are expected to rise by 0.2%. This is a steady price increase in line with the FOMC’s long-range target with one problem for dollar bulls; it is down a tenth from the previous read. A weak PPI figure will reassure equities markets the economy is not overheating but it will sap strength from markets looking for the dollar to move higher.
More importantly, however, will be the read-on CPI, the consumer price index. Consumer prices have been edging higher over the past year and are now sitting above the FOMC’s 2.0% target (according to the favored PCE price index). Headline CPI is expected to tick higher by a tenth to 0.2% in evidence of rising price pressure, bullish for the dollar, while Core CPI (ex-food and energy) is expected to cool a tenth to 0.1%. A hot number, especially at the core, could send the dollar moving higher.
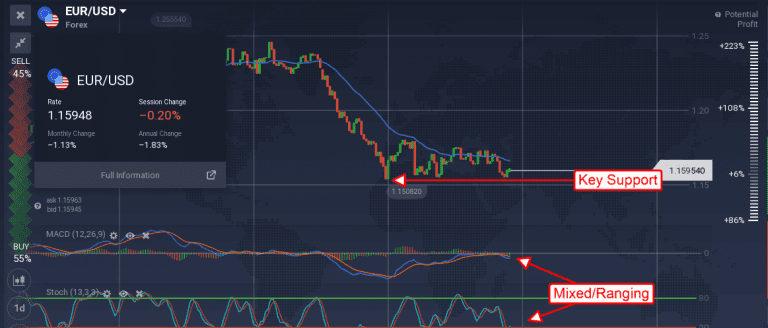
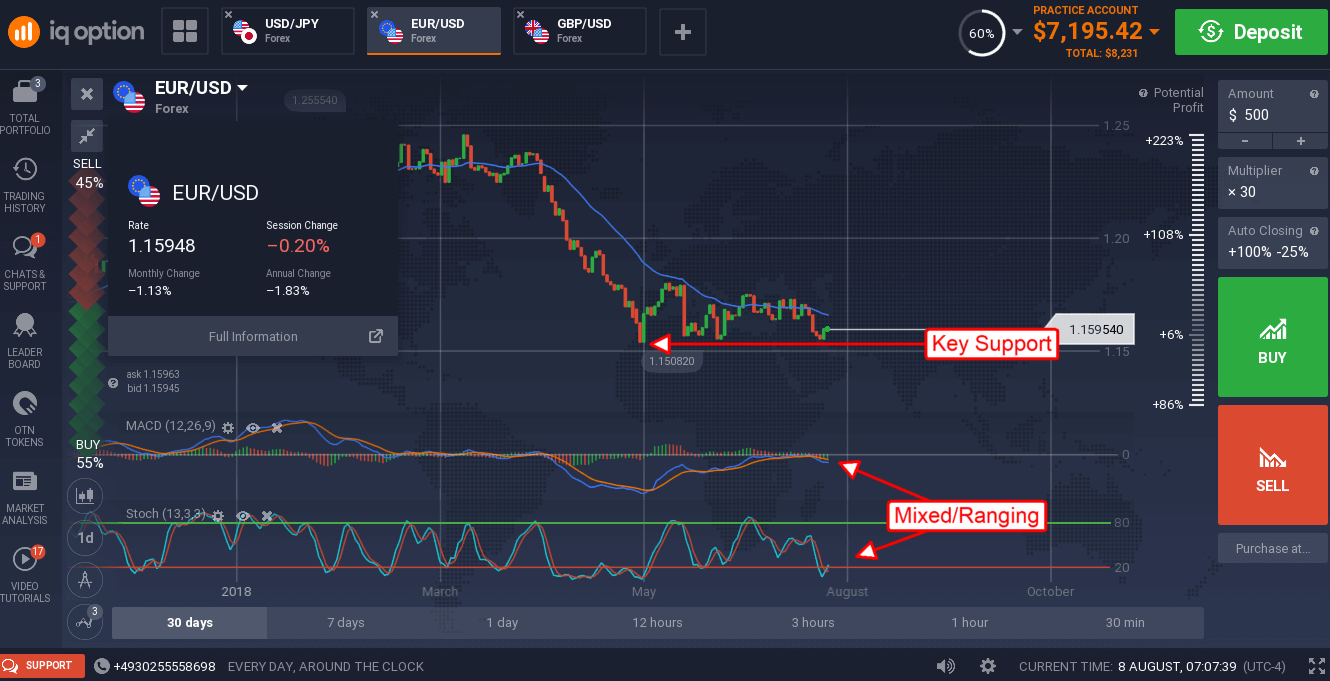
The USD has been range bound versus the EU’s single currency for nearly three months Fed and ECB outlook shifts. While the world’s two most important central banks are still in a slight policy divergence sentiment is slowly shifting toward the Euro. EU data supports steady, but not strong, economic growth and that has the ECB on track to end QE this year. The EUR/USD is now sitting just above the long-term low and waiting for the next cure. A move lower will retest support at the 1.1525 level, a move below support would be bearish. A move up will face several resistance targets in the range of 1.16250 to 1.1790, a move above 1.1790 would be bullish.
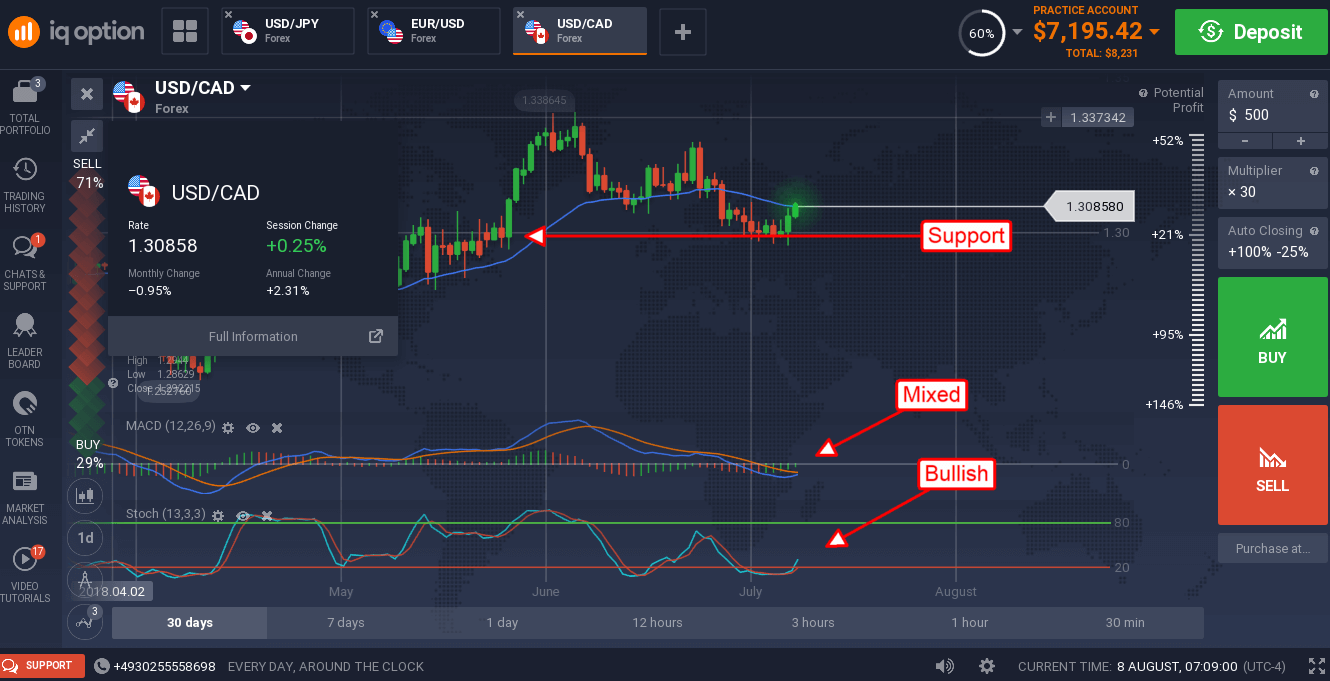
The USD has also been showing some weakness versus its northern neighbor, the Canadian Dollar, but that weakness may be coming to an end. The USD/CAD has moved up strongly over the past two days and is now breaking above the short-term moving average. This pair is dominated by US/Canadian trade tensions and likely to move higher as the US economy outpaces Canada and the rest of the world. The indicators are consistent with support 1.3000 and an upward shift in momentum. The first target for resistance is 1.3200, a move above that could retest the recent high near 1.3400.
The USD/INR has been trending sideways at long-term highs for over a month as global trade tensions cap gain. Now that the US and India are squaring off in preparation for trade battle it looks like the pair will break to the upside and move higher.
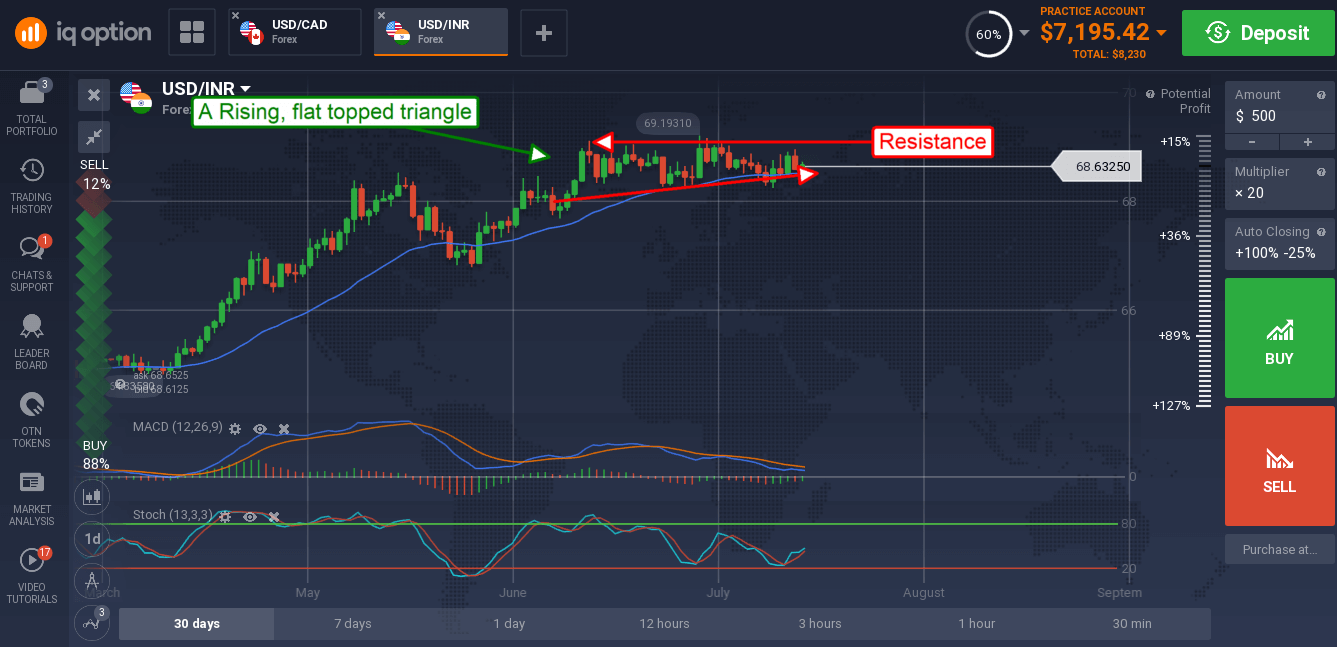
The indicators remain mixed but suggest upward movement within the range is dominant, a move above the top of the range at 69.00 would be bullish.
