A pair of political events have sparked capitulation in the single currency. In Italy a failed coalition has left the country without a government while in Spain a vote of confidence sets the stage for political change there as well. Over the weekend the budding coalition between left and right wing Italian extremist collapsed as turmoil over who would run the country divided the parties. The news sparked the appointment of an interim prime minister, one Carlo Cottarelli, whose job it would be to restore political order.
The fear now is that a new election could swing voters one way or the other. An extremist government in Rome would lead to more drastic changes within the nation and the possibility of undermining economic health in the EU. The next step is for a new round of polls to see which way the population is leaning.
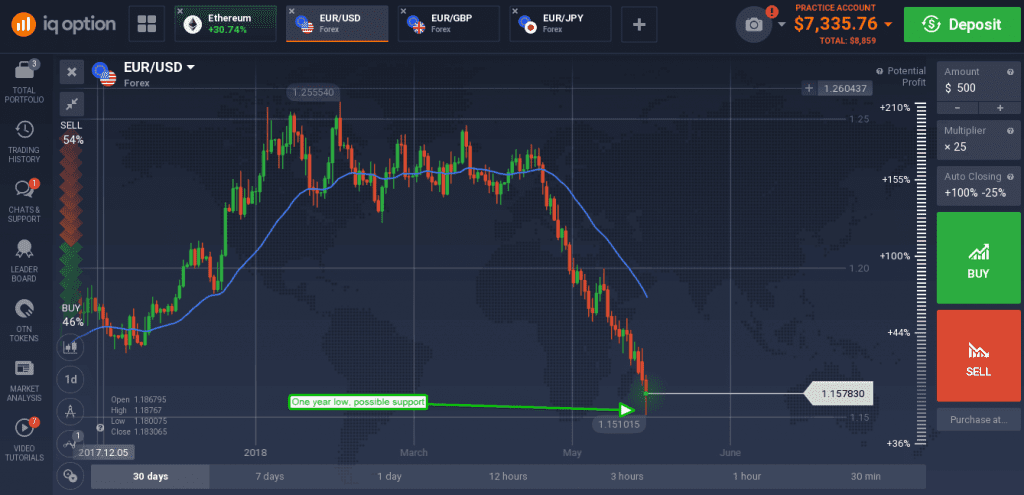
The EUR/USD fell hard on the news, dropping below support targets to hit a new one year low. The pair moved down to the 1.5100 level where it met support in early Tuesday trading. The pair bounced and formed a candle with long lower shadow although support will not be confirmed until the next candle forms, if then. The indicators are bearish but with some caveats. The first is that MACD is highly divergent from the news low, the second is that stochastic %K is above the %D line despite both moving lower, both of which are signs of support and potential for reversal. If the pair does snap back resistance is expected at 1.6750.

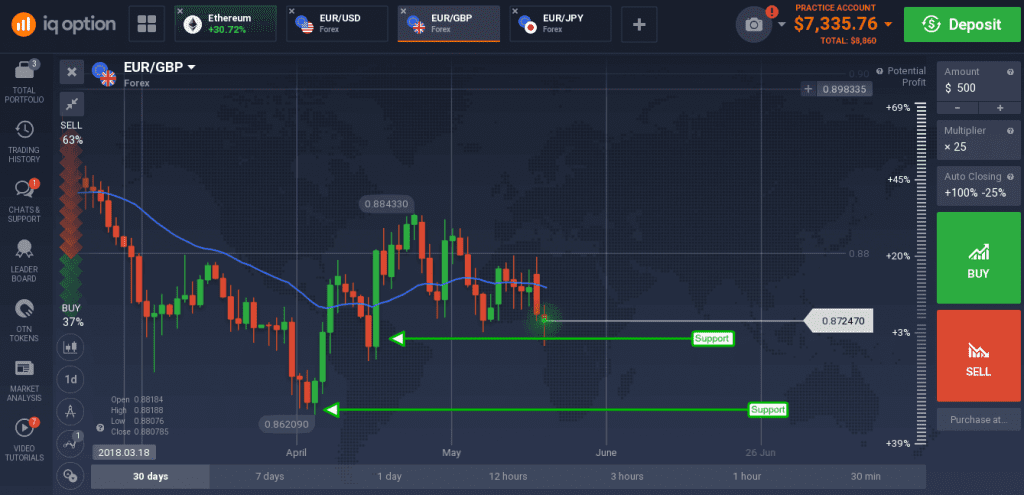
The single currency fell against the pound, but support was met here as well. The candle formed in early Tuesday trading is medium sized with long lower shadow, consistent with support at the bottom of the trading range. The indicators are both bearish and pointing lower, so support is likely to be tested again, the caveat is that they are also both showing signs of support that may keep the pair trading within the range longer term. Support is near 0.8700, a break below there may go to 0.8600.

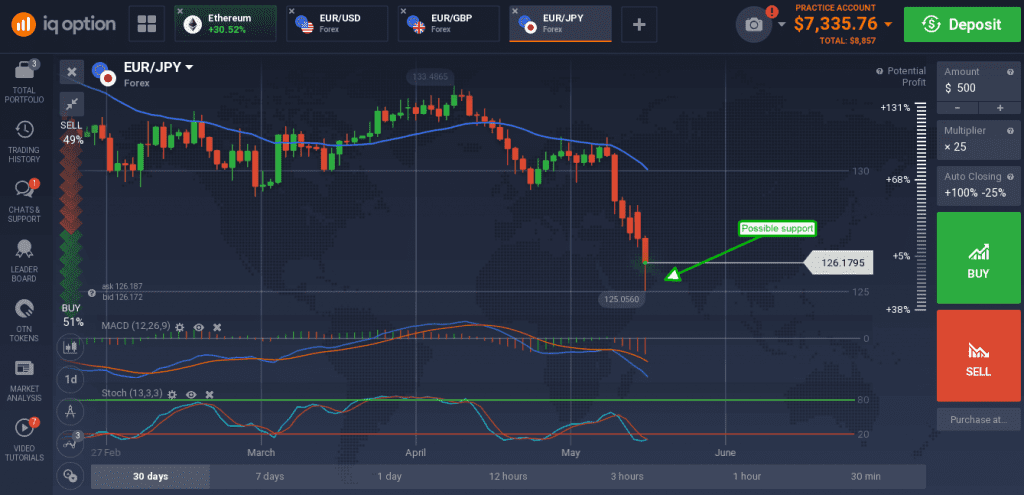
The EUR/JPY fell to a one year low as well, creating a long green candle with long lower shadow indicative of potential support. This support is at or near 126.12, consistent with the mid-point of a long green candle which formed while the pair was moving up to it recent highs.

The indicators are both bearish, consistent with falling prices, but neither are strong and there are some indications support may be found at or near this level.

