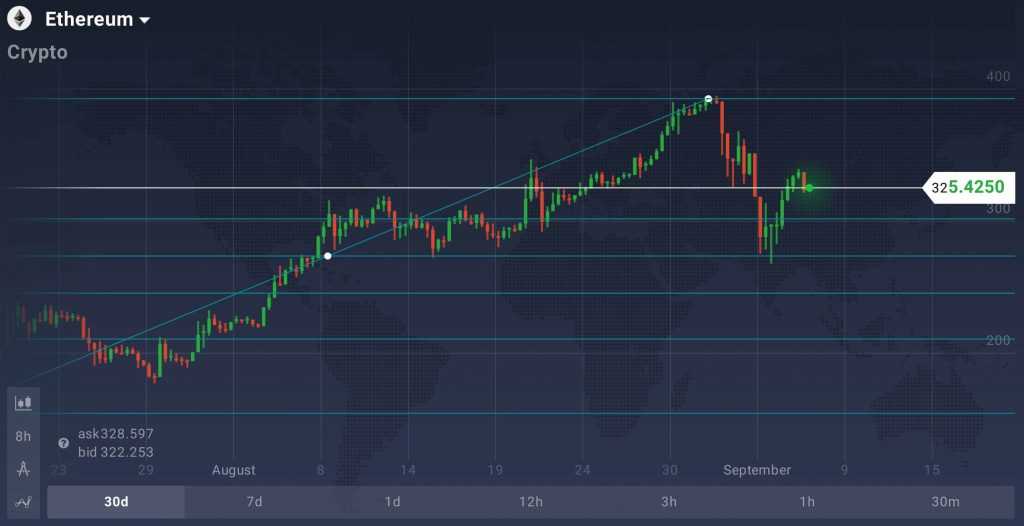
Ethereum, currently the world’s second largest cryptocurrency with a market capitalization of over $30 billion, was severely damaged by the recent market plunge, triggered by the introduction of unfavorable ICO regulations in China. In the months preceding the surge the coin demonstrated stunning performance. Traded at around $11 on February 2nd, Ethereum has reached $387 just hours before the crash. Since then it had retraced to $155 but quickly rebounded to $392, reaching yet another all-time high. The ETH price action is back in the red now.

Ethereum is currently traded at $323, which was last seen on July 23rd. Several observations can be made when using technical analysis indicators, one of them being Fibonacci Lines. The drop from $392 to $274 marked the 50% retracement. The price action then rebounded and passed the 61% retracement without stopping. The reading of the MACD indicator can be used as another confirmation of an upcoming negative trend.

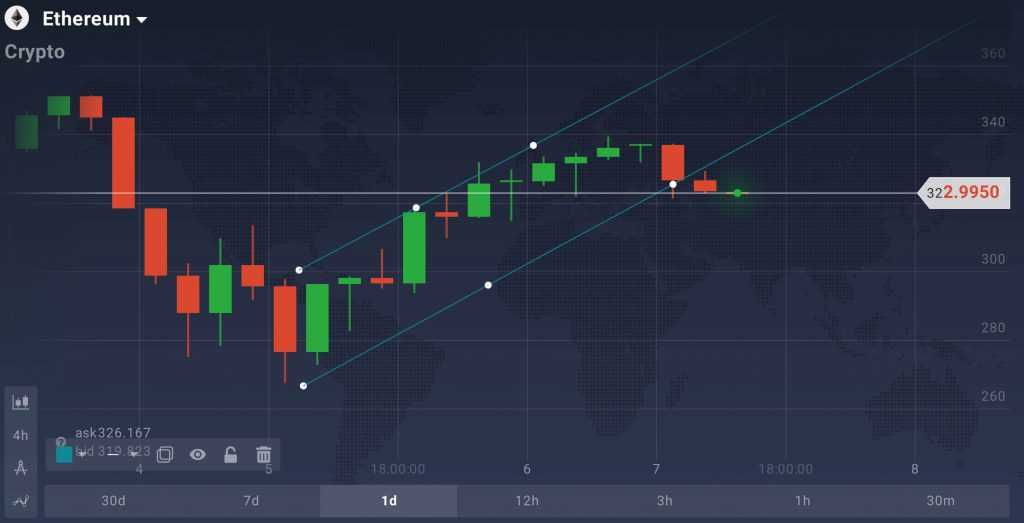
The short-lived bullish trend that brought the ETH price $48 up seems to be out of breath. The beginning of a new trend, this time bearish, corresponds to the appearance of three red candlesticks. This trend can be expected to continue in the short-term.


