
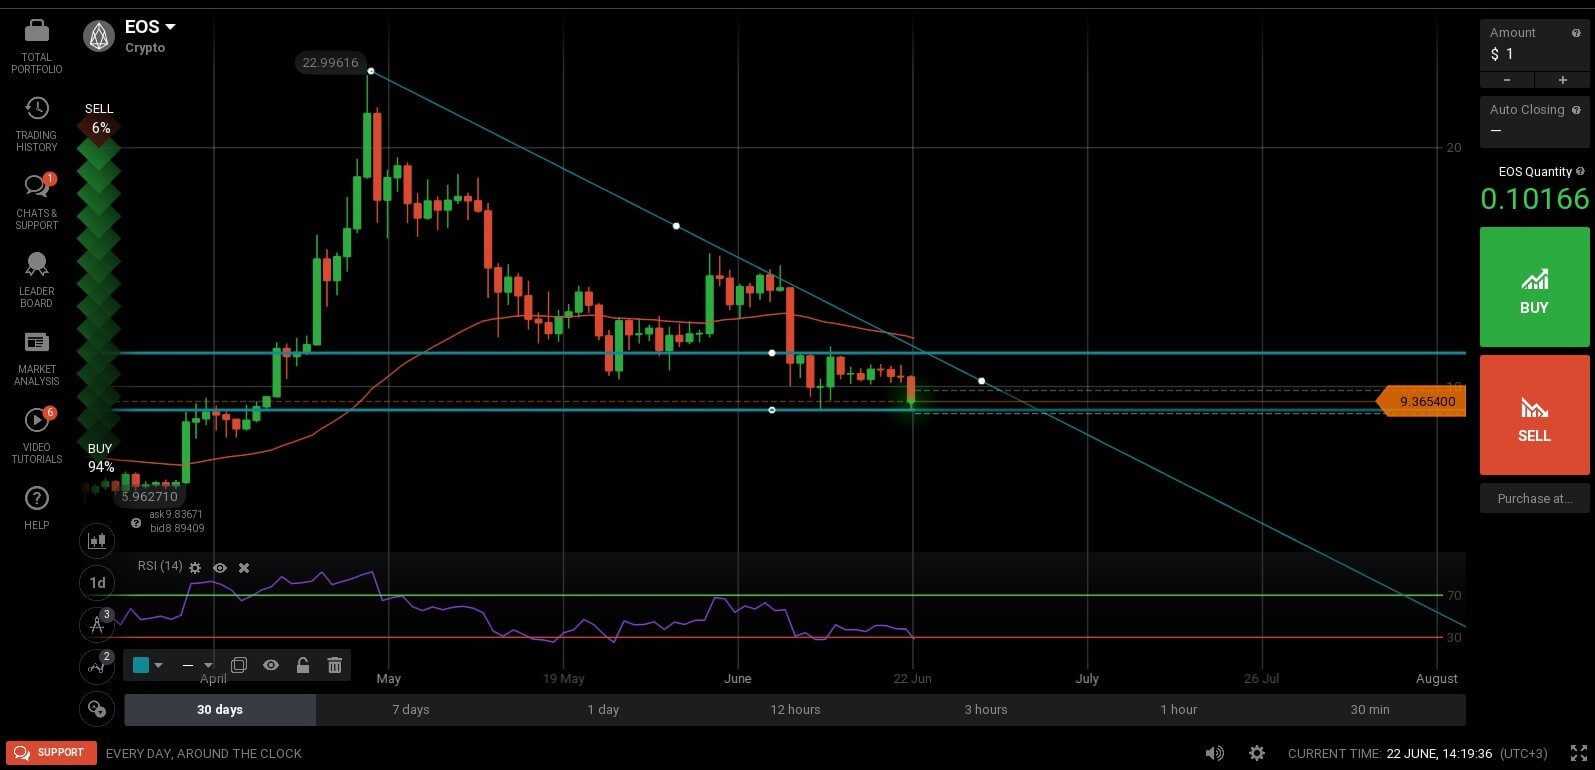
Despite the recent launch of EOSIO public blockchain and main net, EOS is on a downward path. This is a clear case of buy-the-rumour/sell-the-news and is setting the token up for another rally. The chart is beginning to show oversold levels on multiple time frames, which is a bullish sign trader should not ignore.
The big picture
South Korean crypto exchange Bithumb was recently hacked and the equivalent of more than $30 million was stolen. According to their representatives, the event occurred between Tuesday and Wednesday night but it’s not clear if this has anything to do with the recent bearishness seen in the crypto market. Hacks like these (just about 2 weeks ago Coinrail was hacked for $40 million) are certainly not helping the industry and people’s trust in it but are a problem with the exchanges and storage rather than the underlying tokens.
And now for more optimistic news: China recently launched a Global Public Chain Assessment Index, a platform meant to provide extensive reviews regarding blockchain projects across the globe. The latest Index publication showed that EOS is the most popular cryptocurrency in China and this may generate a new wave of buying, especially once the technical traders get involved.
Deciphering the technical chart

The EOS/USD dropped to create a double bottom at $9.10 and is now oversold on multiple time frames (the Relative Strength Index is at or below its 30 level). This is a strong indication that we will see a push up, with $10.80 – $11.00 as initial target and $11.40 in extension. Keep in mind however, this is just a potential scenario, not a clear buy signal. If the current support (double bottom) is broken, I don’t expect to see a prolonged drop because the pair is already deep in oversold territory on a 4H chart
Support zone: $9.10
Resistance zone: $10.80 – $11.00 followed by $11.40
Most likely scenario: push up into the first resistance zone
Alternate scenario: drop below current support but with a limited follow-up
Bitcoin Erases Gains
Just when the rainy days for Bitcoin appeared to be over, the world’s reserve cryptocurrency was hit by a fresh wave of selling. There’s no clear reason behind the drop, other than an overall bearish sentiment and some uncertainty coming stemming from recent exchange hacks.
Deciphering the technical chart
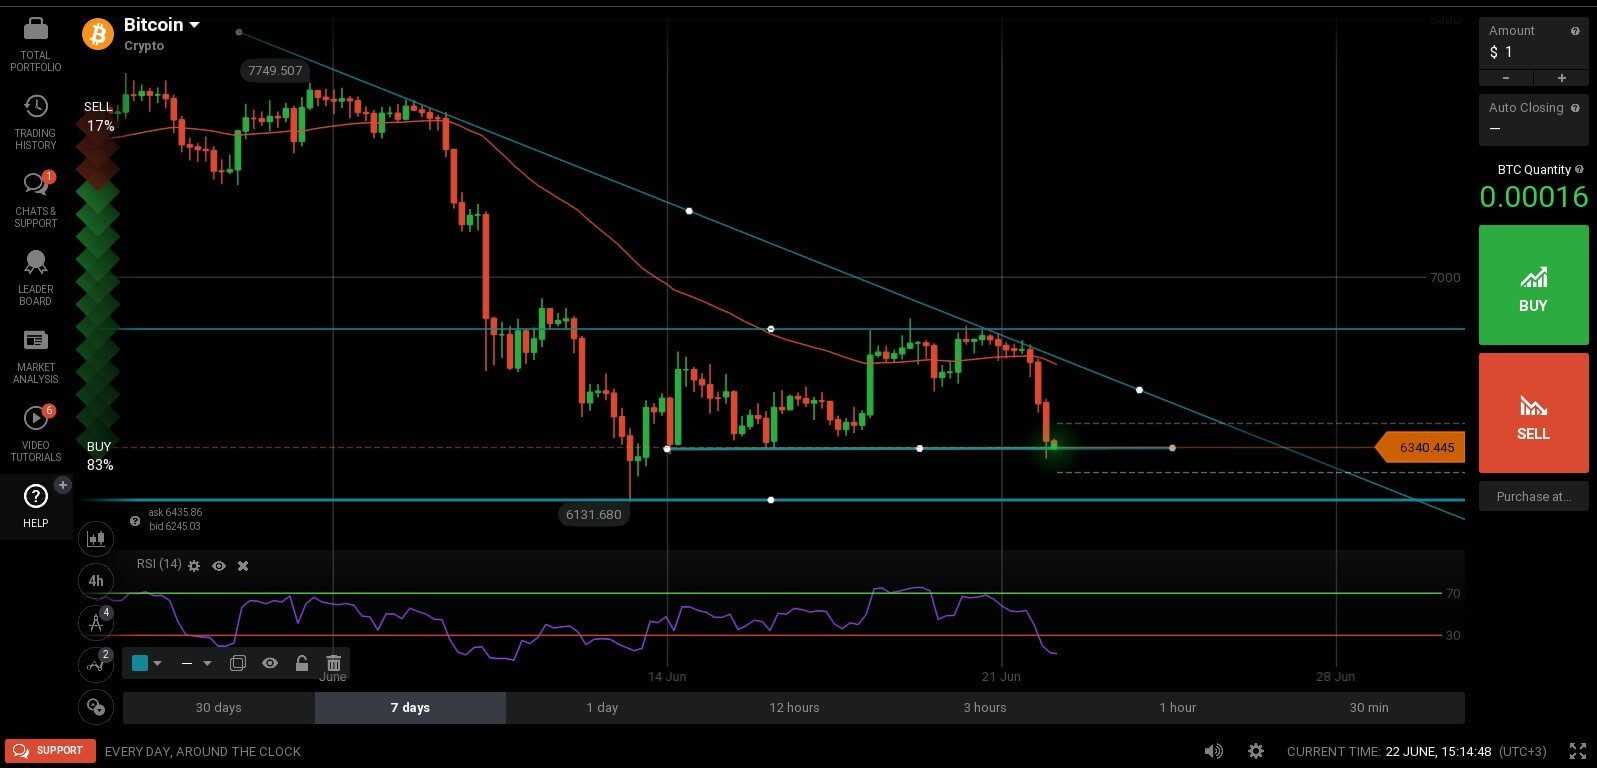
After failing to break the resistance around $6,800, Bitcoin fell rapidly into $6,330 area at the time of writing. This is a previous zone of support but not a very strong one, so we could easily see an extended drop into the low at $6,131.
The pair is capped by a bearish trend line and is trading below the 50 period Exponential Moving Average on a 4H chart (bearish signs) another sign of resistance. The Relative Strength Index is deep in oversold territory though, and this may generate a bit of upside movement, albeit I don’t expect a climb above the trend line at this time.
Support zone: $6,330 – $6,350 followed by the low at $6,131
Resistance zone: bearish trend line, 50 EMA and $6,800
Most likely scenario: move into the low at $6,131
Alternate scenario: climb into the trend line
