
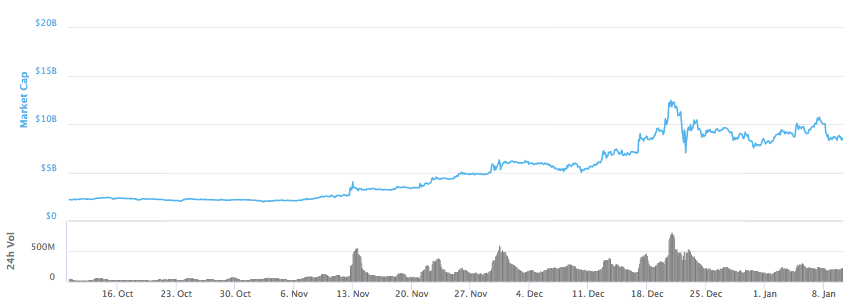
The past week, DASH moved in a zigzag fashion. The coin is mostly trying to stabilize now instead of achieving a new high. Because of the massive gains by the other coins, DASH was briefly knocked out from the list of top ten coins, but soon it regained its position as the 10th largest coin, according to coinmarketcap.com. Currently, DASH has a market cap of above $8.6 billion.
- DASH/USD pair found a strong support at $1050, and if the coin can breach the resistance at $1125, an upward rally might follow
- Without any substantial gain over the week, DASH/BTC is trading at 0.077 BTC
After moving sideways for a while, DASH dropped to $1048, where the support acted as a pivot and the coin jumped above $1170. But there the resistance level was too strong, but DASH had support between $1070 and $1100. The earlier also acted as a pivot and initiated an upward rally.
The coin went over $1230, where the peak resistance resulted in a pullback and a bearish run took over. At a point, the coin even dropped below $900. The support at $1050 then hold the prices and checked any further drop. But a new resistance formed at $1125. The coin is currently testing this resistance level with the support level present at $1150.
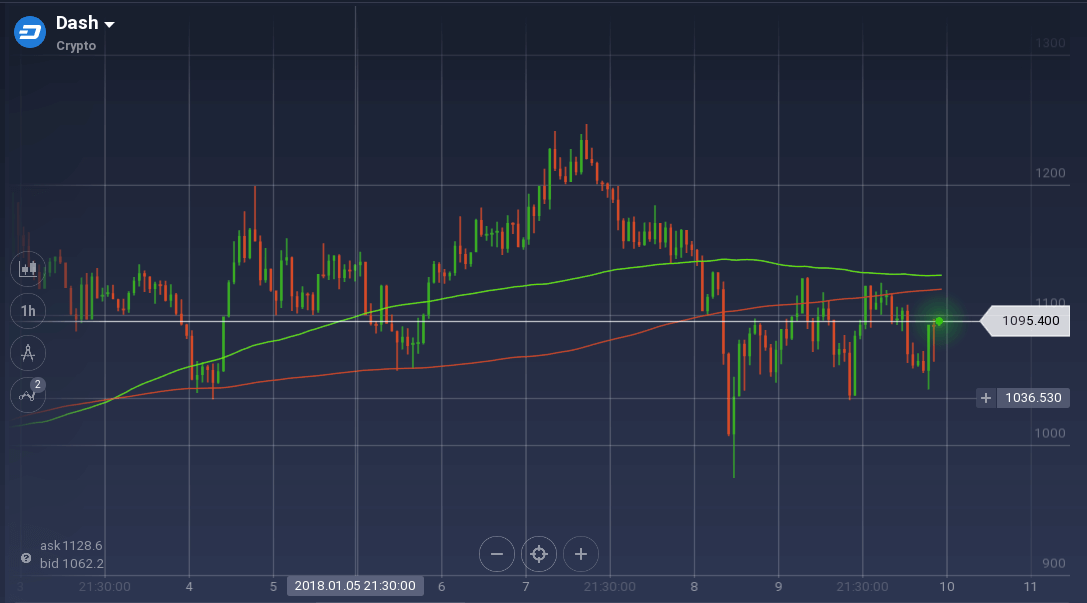
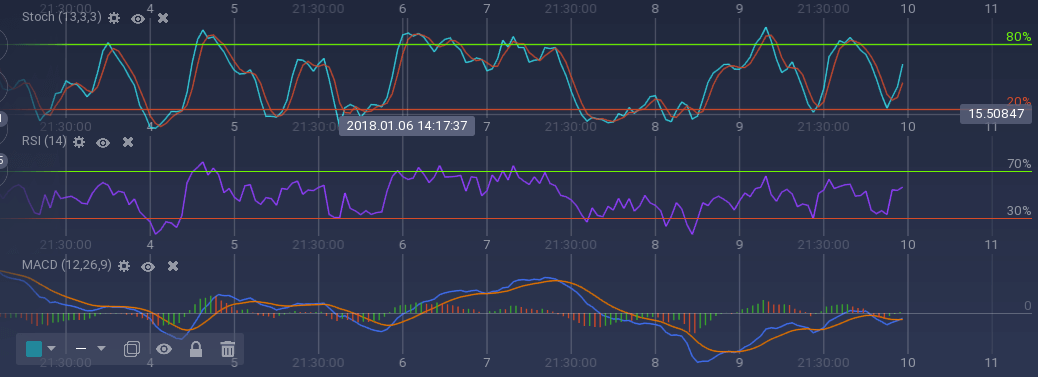
Because of the newfound support, the oscillators are moving up signing a positive movement. Stoch is going upward and so is RSI, which is currently at 57 percent. Because of the bullish rally in the early week, 100 SMA is still above 200 SMA, but the bearish run is resulting to close up the gap. The coin is also approaching 50 percent Fibonacci level.
Against Bitcoin, the value DASH almost remains unchanged over the week. Though in the midweek, the value dropped to 0.0633 BTC, the quickly recovered and is currently trading at 0.077 BTC.
