The cryptocurrency market is back in the red. Financial experts have been trying to wrap their heads around the phenomenon of cryptocurrencies for several months already. Yet, there is no solid universal opinion on what the future of Bitcoin and its younger peers looks like. Since the beginning of 2017, the cryptocurrency market capitalization went from $17 billion to $133 billion. And it was even higher on September 2nd, when the all-time high of $178 billion was hit.
Fundamental vs Technical
Can the explosive growth simply turn into a bubble? Yes, it can. The demand for cryptocurrencies has been fueled by millions of new entrants with no particular understanding of the market. However, it is still too early to conclude that cryptocurrencies are no more. Even after the possible downfall of the cryptocurrency market cap, the blockchain technology and the digital money will play an extremely important role in the 21st century global economic system.
Due to decentralized nature of the cryptocurrency market and the lack of regulative authorities, the number of fundamental factors that can influence the exchange rate are limited. Legislative and technical factors are the two most important variables to take into account. The world has already witnessed how devastating their influence can be. Both ICO ban in China and disclosure of a technical vulnerability in IOTA sent the exchange rates down. These factors, however, do not explain a sharp increase in cryptocurrency prices.
Support and Resistance
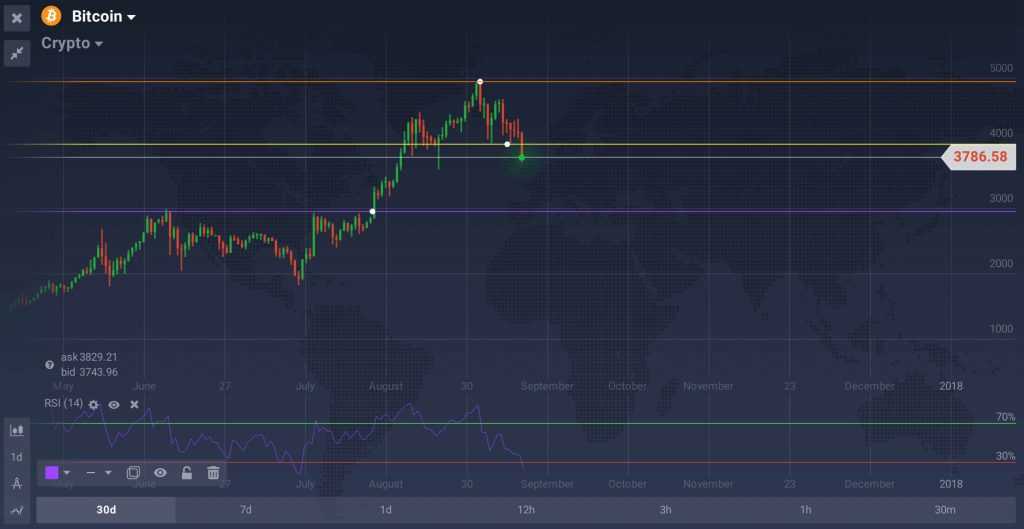
Day-to-day price fluctuations are not necessarily connected to fundamental factors. Technical analysis in this case can provide detailed information on crowd psychology and market behavior. Let’s take a look at the price chart of Bitcoin, that tends to both follow and dictate the general trend. Note that Bitcoin is currently responsible for 48% of the total cryptocurrency market.

Psychological levels can clearly be noticed at around $3,000, $4,000 and $5,000. Purely speculative nature of Bitcoin price movement made round numbers extremely important for ordinary people, who have recently joined the BTC race. People tend to think in patterns. One of the most popular on the cryptocurrency market is “If the price hits $5,000, I am out”. Hence, support and resistance lines at the above-mentioned levels.
The $5,000 resistance level pushed off the upward trend while the $4,000 level did not manage to constrain the falling price. Now, the price action is heading to another psychological level — this time $3,000. Should the BTC price pass through, it can be expected to continue the downward movement and reach its record lows, last observed July 17th.
Fibonacci Lines

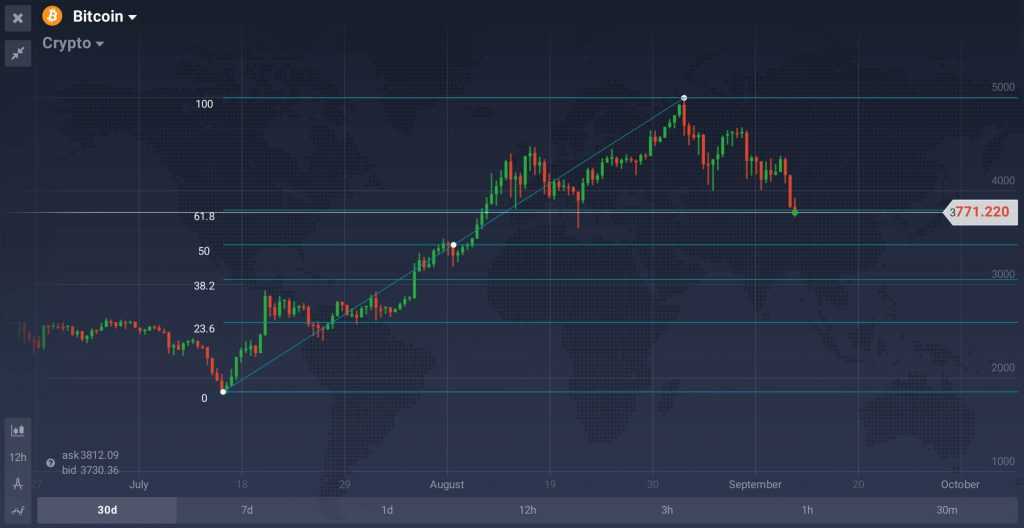
Fibonacci Lines are just another tool for the assessment of support and resistance levels. Not aligned with round numbers, it can still provide sound trading advice and determine the patterns, currently unfolding in the cryptocurrency market. According to Fibonacci Lines, the resistance level is located at $3,800, and it was recently crossed from above by the BTC price action. It means that the price can now be expected to test the next support level, situated at around $3,400.
Conclusion
Technical analysis tools, no matter how accurate in the past, do not always make correct predictions. Yet, it is highly recommended for traders to consider the results they provide, especially when trading highly volatile and unstable assets like Bitcoin. The influence of fundamental factors on the BTC price is limited, thus turning technical analysis and market psychology into important decision making factors.

