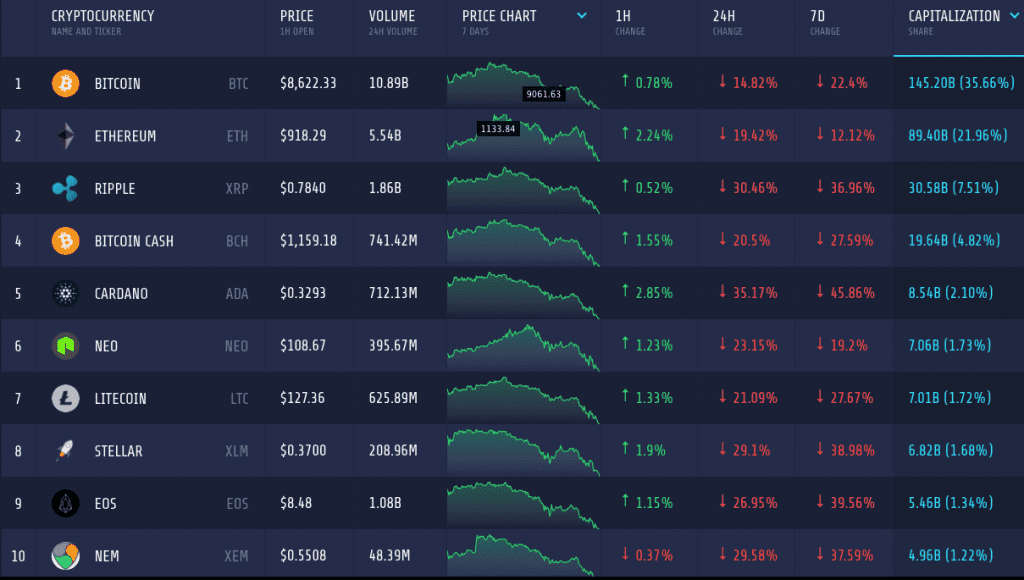
Almost every coin on the chart is red. Since the Chinese crackdown in September last year, this might be the first market crash of this scale. The total market cap of cryptocurrencies went down to $407 billion – less than half compared to its peak in December.
Bitcoin
Though the market leader Bitcoin is not the top looser, it could no more hold its value above $10,000 and went below $8700. This is very significant as Bitcoin still accounts for more than 33 percent of the market share.
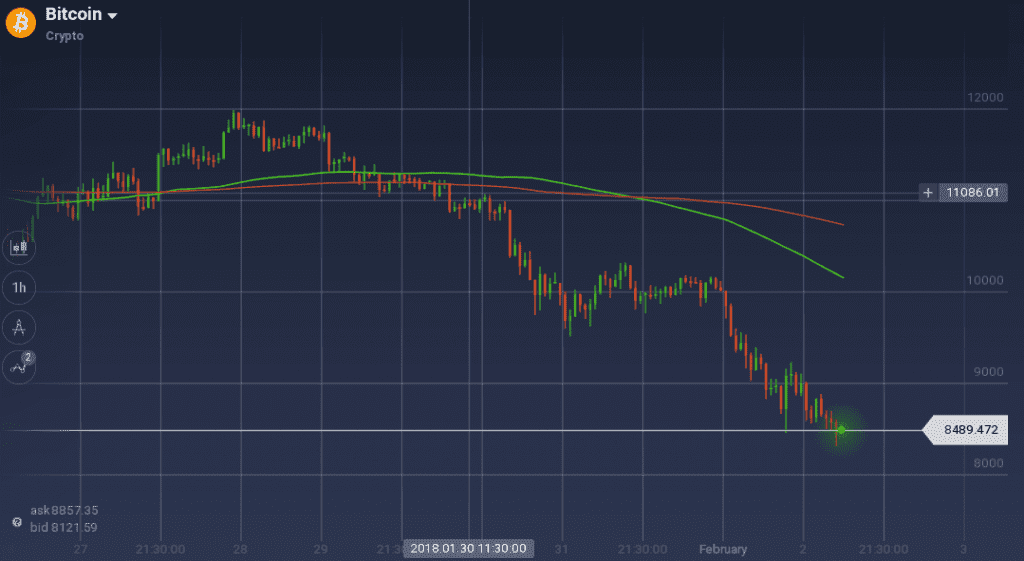
In the last Bitcoin dropped around 15 percent, and thus depreciated more than 22 percent on the weekly chart. On the way to its downward rally, Bitcoin found some support at $9800, but resistance at $10,180 did not allow it to recover any further. This led to a stiff drop in the prices. Currently, BTC/USD is trading around $8500 and there is no sign of any support.

The oscillators are running on the border of overselling zone with an inclination to go down. Currently, RSI is at 30 percent and Stoch at 20 percent.
Ethereum
Ethereum’s market projection is telling us a similar tale. The value of the coin depreciated by 19 percent in the 24-hour chart and by 12 percent on the 7-day chart. Traders are clearly dumping the stock as the trading volume in last 24 hours was $5.54 billion.
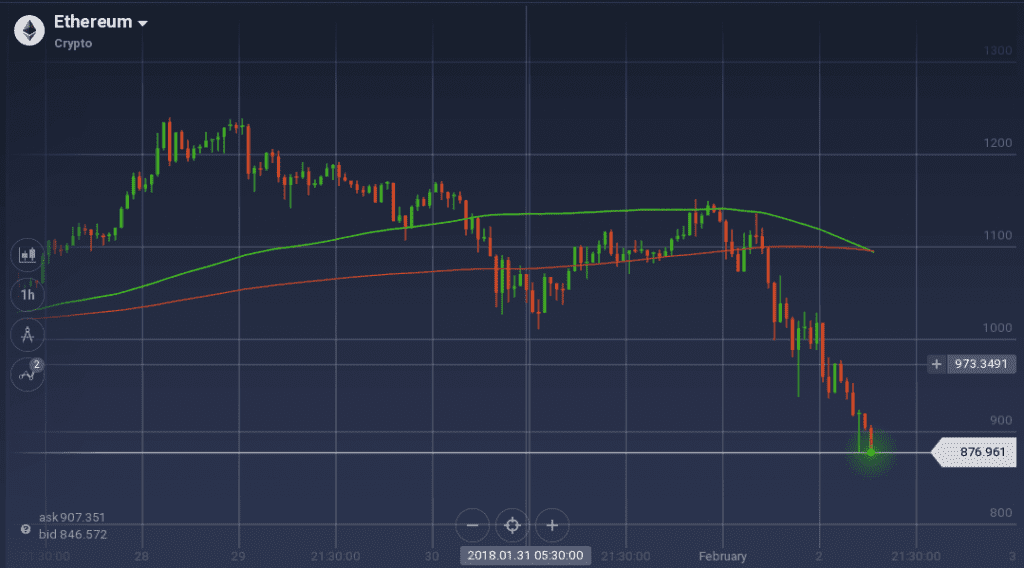
For Ethereum, a gradual downward journey began after it reached the weekly peak at $1240, following a steep bullish run. After dropping to $1023, the coin found support which also acted as a pivot. ETH/USD was on a nice bullish ride when the crash hit the coin and it went down from $1145 to $900 in just 24 hours. Similar to Bitcoin, ETH/USD is on a freefall too.
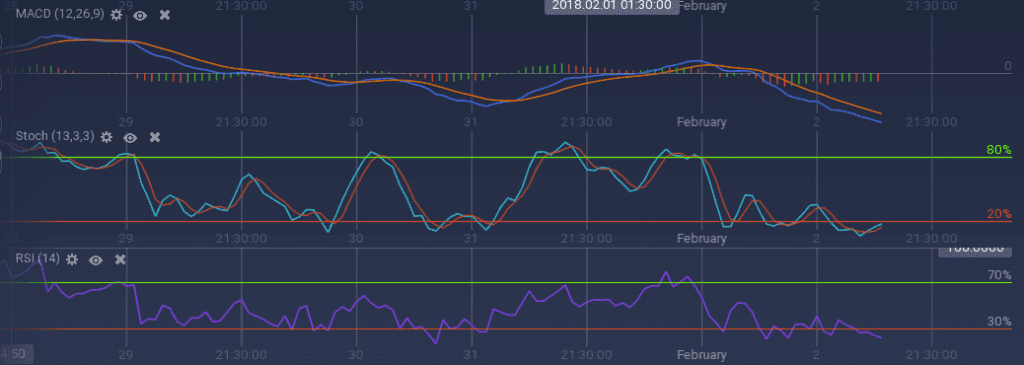
100 SMA was running above 200 SMA till now. However, with the steep bearish dominance, the two curves are on the verge of a cross-over. Technical indicators are also not indicating anything positive. MACD is on a bearish run with a significant gap between the curves. Stoch and RSI both are below the overselling margin. But, Stoch is showing a recovery sign.
Ripple
Ripple is the worst hit coin among the top fours. XRP/USD lost more than 30 percent in the last 24 hours, resulting in a 37 percent depreciation on the weekly chart. South Korean traders are dumping the coin as more than 50 percent trading of Ripple is done against KRW in past 24 hours and trading volume for that period was $1.86 billion. Ripple’s market cap dropped to $30.5 billion amid this crash.
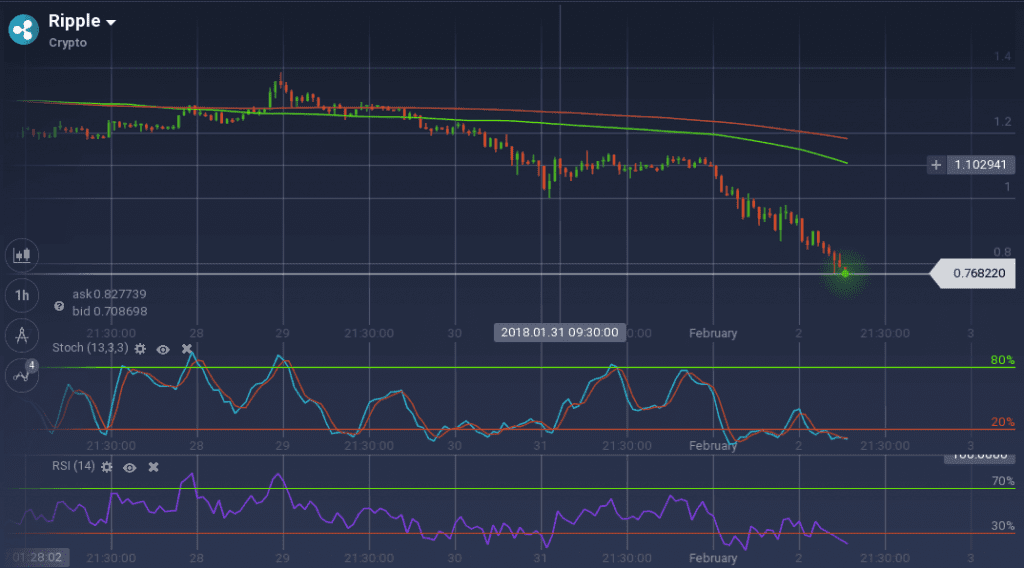
Ripple was on its way down since early midweek, after achieving the weekly peak at $1.35. With a gradual downward run, the coin dropped below $1 but soon started to recover. However, it faced a stiff resistance at $1.13. Support was also present at $1.08. After testing the resistance for a while, Ripple failed to breach the level and the bear took over again, this time a steep one. Since then, XRP/USD is one a freefall with the current value at $0.77.
Both RSI and Stoch is shown overselling of the coin on the traders’ part, but this is not resulting in a trend reversal. As the bear was dominating the market for long, 100 SMA is running below 200 SMA. Currently, RSI is at 21 percent.
Stellar
Stellar was grabbing the headlines since a while due to its high returns. But the bullish coin was not immune to the market crash. It even lost significantly more than many coins, as the value XLM dropped by 29 percent on the daily chart and 39 percent on the weekly. The current market cap of Stellar is at $6.8 billion, less than half from its peak at $16.5 billion.
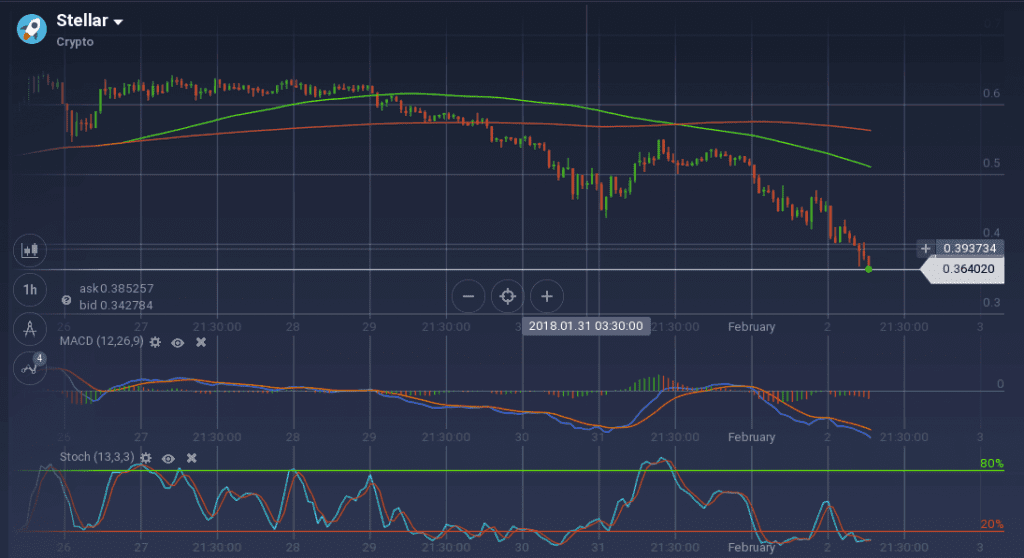
In the early week, Stellar was trading within a narrow band of $0.63 to $0.61. But soon the bear took over, and the coin dropped to $0.43. With a sudden recovery, XLM/USD pair went above $0.54 but the resistance did not allow it to recover further. With a temporary support, the pair tested the resistance a couple of times but failed. Then the steep bear took over and the pair went down to $0.36.
Similar to other coins, the technical indicators are not indicating any sign of positive movement. Though Stoch is running in the overselling zone for a while, there is no sign of any trend reversal. MACD is also running bearish along with most of the other indicators.
Market Update
Yesterday, in the annual budget speech, Indian Finance Minister made it clear that the country does not recognize Bitcoin or any other cryptocurrency as a legal tender. But there was not any indication of an immediate ban. The Minister also praised blockchain technology and encourages its use on the payment systems.
Conclusion
The market crash baffled all the cryptocurrency investors. Unlike the previous one in September, there was no significant activity to drive such crash. Though many investors are dumping their assets, it might be a good time for the optimists to grab some at low prices.

