
It’s one thing to learn a theory, to back test it on your charts and know what to do when it comes. It is something else indeed to see the thing occur before your very eyes and then do the right thing about it. What am I talking about? The global financial equity market rebound that is about to happen.
I am a trend following trading and have written many posts about time frame trading, trend-following trading and the power of those techniques. Now is the time to use them. Look below at this chart of the SPY CFD offered by IQ Option. It is an ETF that tracks the broad market S&P 500 index and a great way for traders to get exposure to the US. It is in the middle of a deep correction, a correction driven by fear, political unease and trade war. To look at the chart is to inspire fear, if you don’t know what you are looking at.
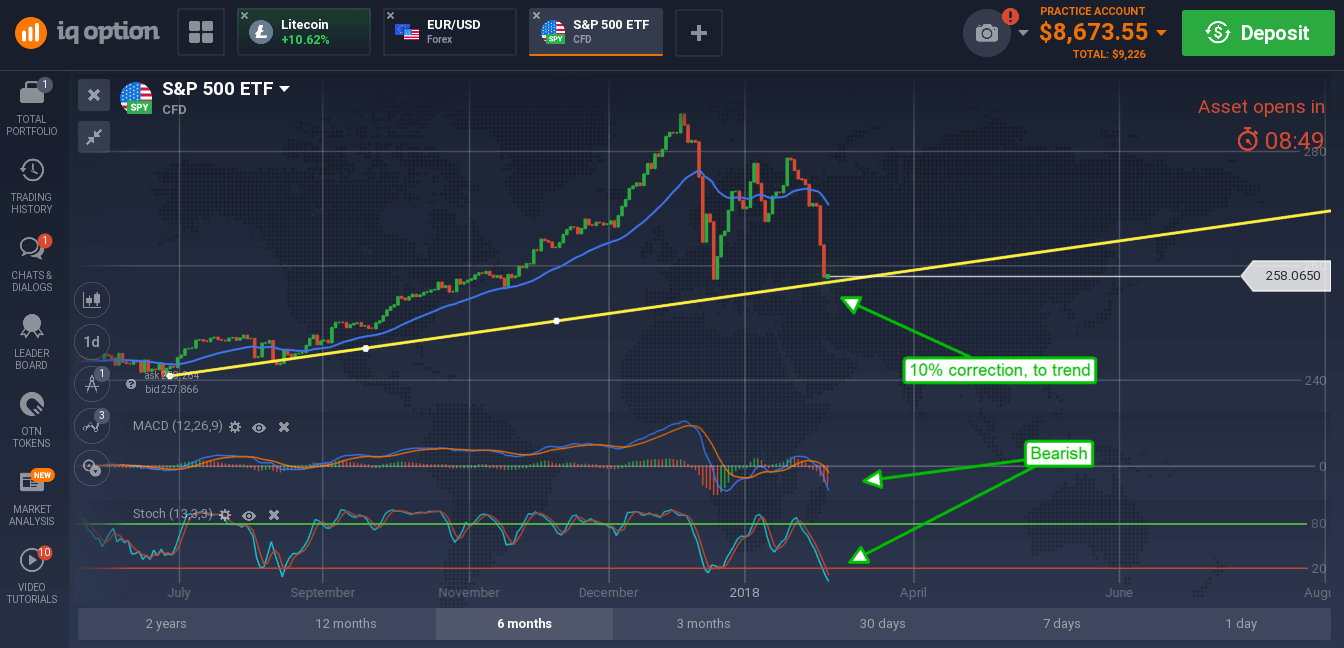
A move out to the longer-term chart of weekly candles we see an index that is clearly in uptrend. It is in correction, but a correction to trend and not a reversal. A look at the indicators confirms this. MACD has made a bearish peak but not a strong one and that peak is subsiding. Stochastic likewise has retreat to low in its range but is still well supported in the middle of the range and is indicating support at the trend line. Further, support is also indicated by the long term 150 day moving and price action early Monday morning.
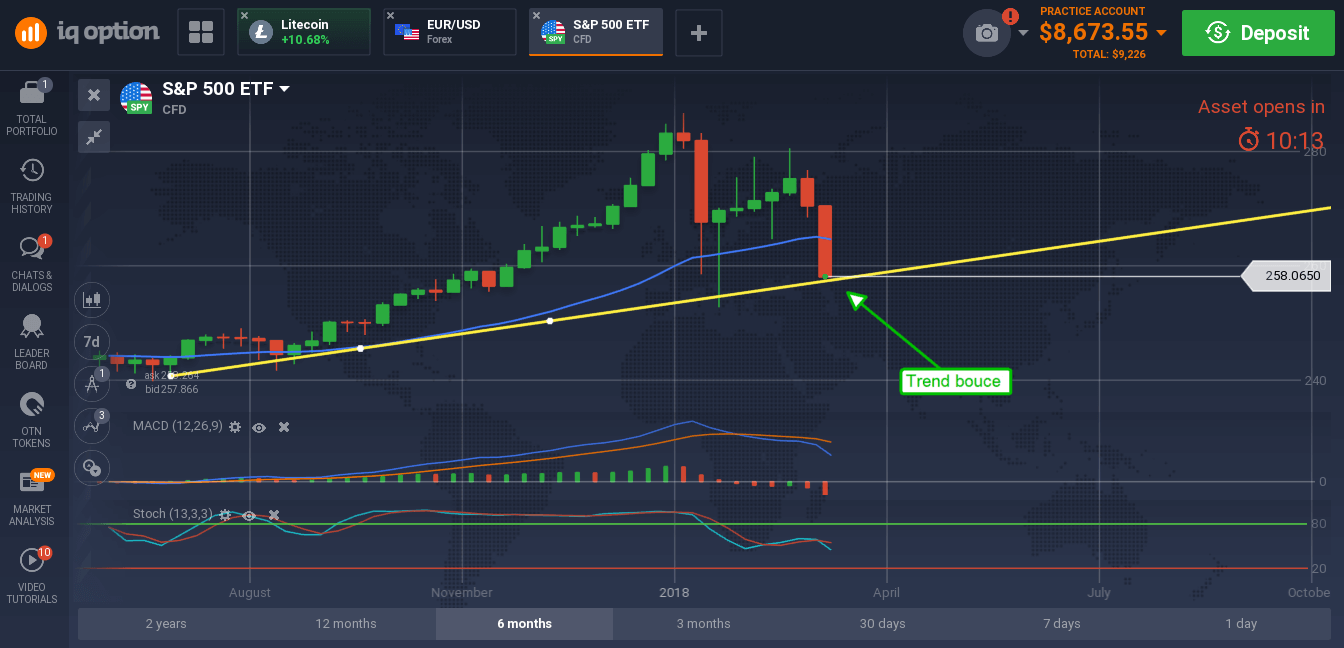
S&P 500 futures surged 1.5% in early Monday trading as geopolitical and trade-war fears subside. News the US and China were working to avoid trade disputes was well received leading traders to take advantage of extra-low market prices. The move is a great sign for bulls as it confirms support at the moving average but also indicates rebound is at hand. The market may not move straight up but it does mean the market will be moving up.

What is the opportunity for traders? A sustain period of uptrend in which bullish signals will carry a high probability of success and above average movement. Investors are going to begin flooding back into the market, driving prices higher providing ample entry points for short-term and day traders. Traders are now advised to go long the SPY targeting accepted bullish entry points on the indicator of choice. I prefer stochastic for this job as it does a superb job at signaling trend following entry points.
At this stage of the game, once again using the daily chart, any bullish crossover in the stochastic is an entry point for short term trades. Day traders can use those crossovers as the indication to move to a lower time-frame, like the hourly charts, for near term intraday bullish crossovers. Resistance levels should be watched and can be used as exit targets on winning trades.
