Homepage » Indicators » Page 4
Traders use indicators and technical tools in order to find entry points and potentially catch the right time to execute...
One of the most commonly used indicators, the Moving Average, has many variations and setting options. It is a lagging...
You may find the best trading indicators in the Popular section in the traderoom. Why? Because these indicators, as well...
This is a crash course for novice traders. Do you want to learn about 5 different indicators, how to apply...
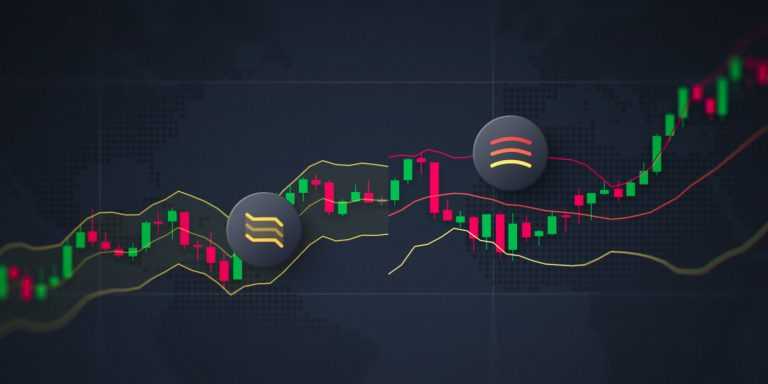
The two indicators, Stoller Average Range Channel (STARC) and Bollinger Bands may look very similar when applied on the chart....
RSI (Relative Strength Index) is an effective indicator that is widely used by both novice and experienced traders. Why is...
The Historical Volatility Indicator is a statistical measure of volatility for a certain asset or security over a set period...
The Envelopes indicator is a relatively simple in use trend indicator which can be applied on its own or paired...
When used on its own, the Stochastic is merely a complimentary tool used to confirm signals from other indicators. However,...