In an already stagnant market, a few recent activities closely tied to the crypto space has put the market in turmoil again. The ban on cryptocurrency ads by Google has proved to be one of the major factors in the market crash. As all the coins, except a few handpicked ones, are bleeding tremendously, the total market capitalization has come down to $312 billion – compared to $374 billion just 24 hours back.

Bitcoin
Though after falling to below $6000, Bitcoin has rebounded aggressively, the resistance at $11,000 turned out to be a massive barrier in its progressive path. However, with the recent crash, Bitcoin is dipping again and finding it very hard to keep its value stable. The original cryptocurrency has lost 14.5 percent in the last 24 hours, which contributed to the weekly depreciation of 21 percent. Though Bitcoin still dominates the market with 42.6 percent of the market share, it is holding a market cap of $132 billion – at its apex, Bitcoin market cap was more than the current total market cap.
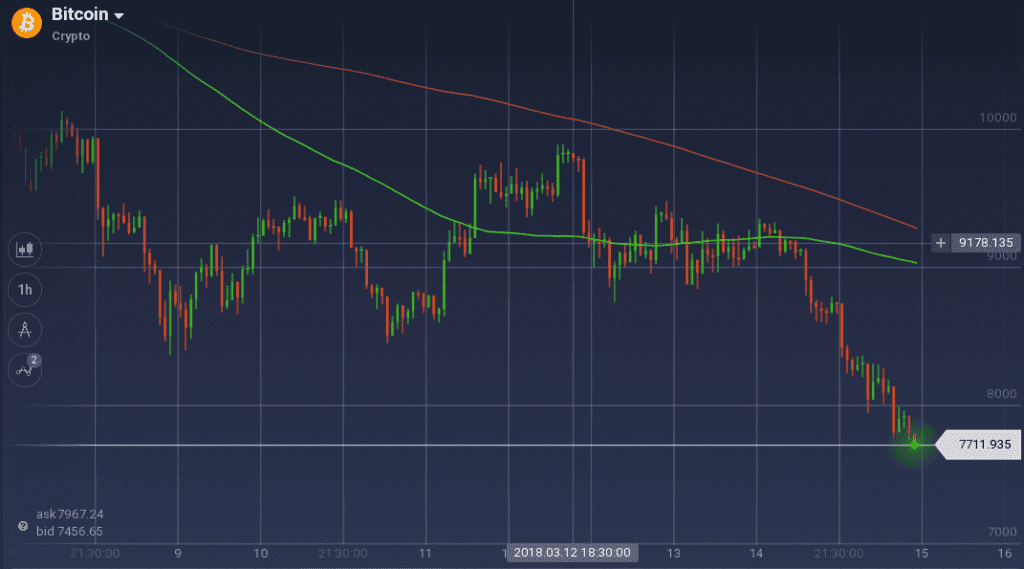
On the weekly chart, Bitcoin had a roller coaster ride. The coin started the week by dipping to $8395 from above $10,000. Though it rebounded with force, resistance at $9,500 and $9,800 became barriers in its path. The coin found support at $8,900 later the week, but new resistance at $9,350 checked its growth.
On the daily chart, BTC took a massive downturn and is in a freefall without the sign of any support. It went down from $9,300 and is now trading around $7,700.
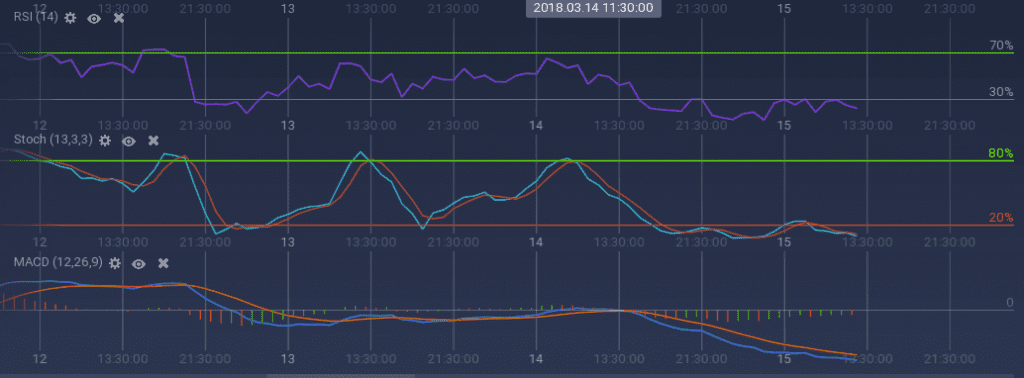
Because of the dominating bear, the technical indicators can only show dips. Both the oscillators – Stoch and RSI – are running below the overselling market for almost a day now, but there is no sign of any trend reversal. MACD is also running bearish below the axis.
Ethereum
The smart contracts leader Ethereum also took a massive blow by the market turmoil. The coin is down by 15.5 percent on the daily and 22.5 percent on the weekly chart. With $57 billion in market cap, the coin is currently trading around $585.
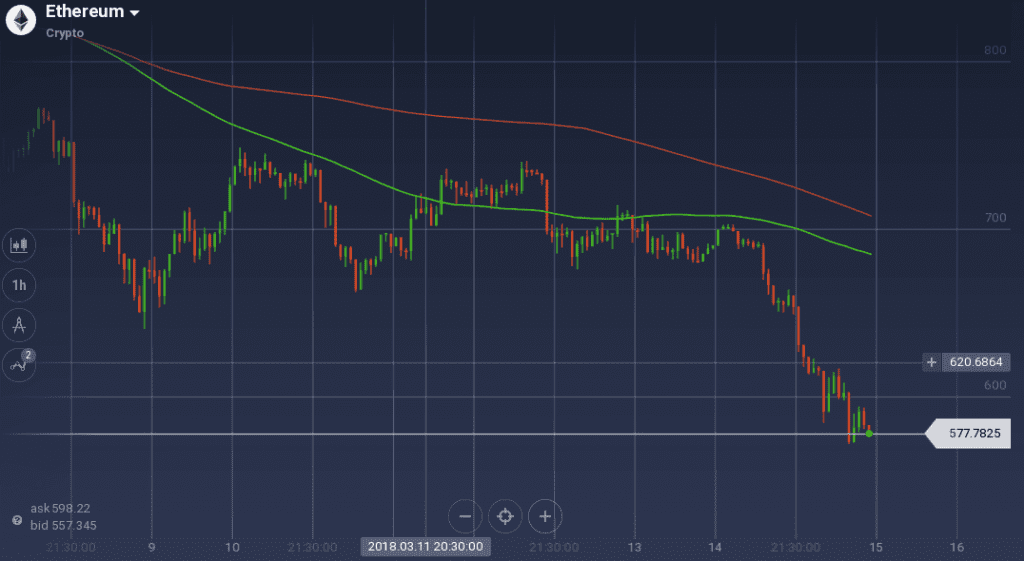
Ethereum followed an almost similar zig-zag price curve as Bitcoin’s. Though the coin rebounded after an early week dip, it soon faced resistance levels at $740 and $730 consecutively. Though it found a support at $680 later the week, the massive market bear soon took over. In the past 24 hours, the coin went down from $700 to below $580, and till now, there is no sign of any support.
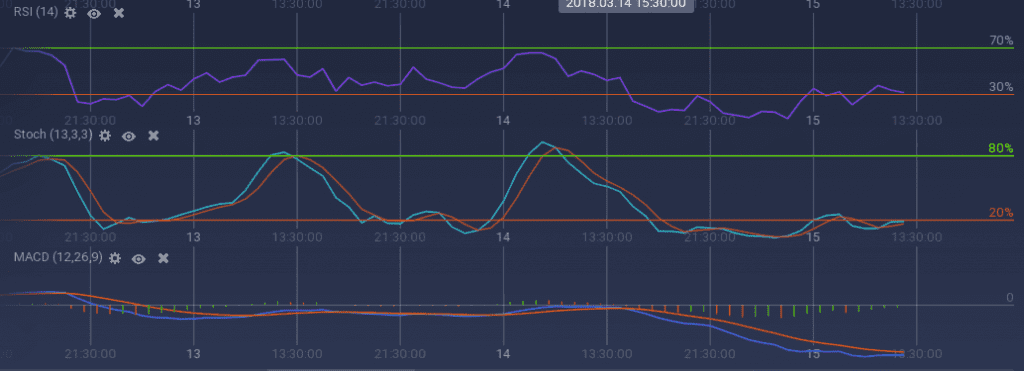
The technical indicators are telling a same narrative as the price curves on the daily chart as all the indicators are no a downward spin. Stoch is hovering below the overselling axis, but RSI has gone up and currently at 33 percent. MACD is also running bearish way below the baseline.
Ripple
Ripple turned out to be the biggest loser among the top three coins. It depreciated by 17.5 percent on the daily chart, which added to the 25 percent weekly depreciation. As always, the largest trading volume of XRP is coming out from the South Korean exchanges with 45 percent of total $610 million.
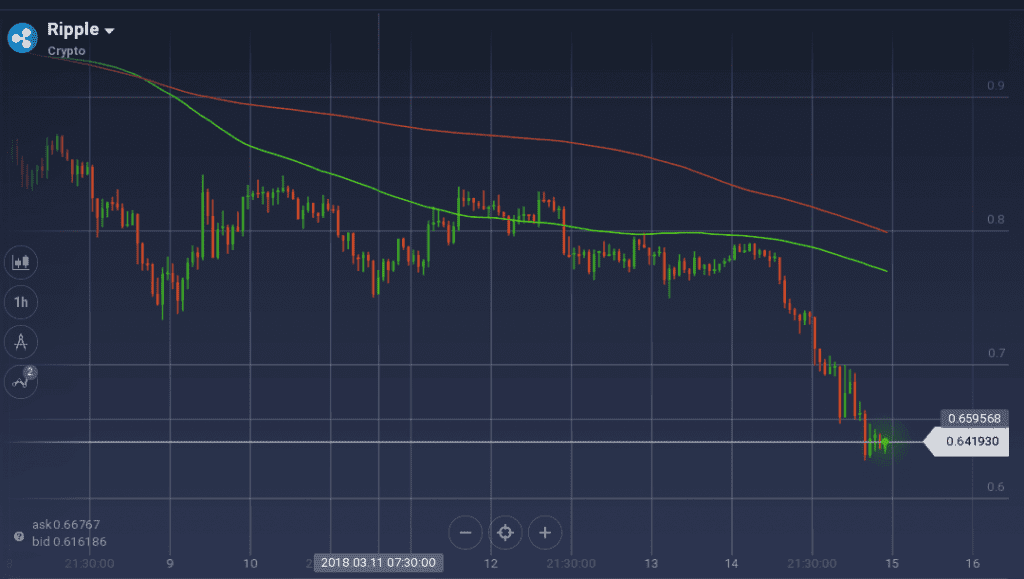
Considering the weekly chart, Ripple faced mammoth resistance at $0.82. After testing the resistance, a couple of times with support at $0.74 and $0.75, it could not way pass over that. The coin found another support level at $0.76, but resistance level also formed at $0.79 which acted as a barrier for a bull. With the market crash, XRP took a downturn and with a steep bear, it went down to $0.63.
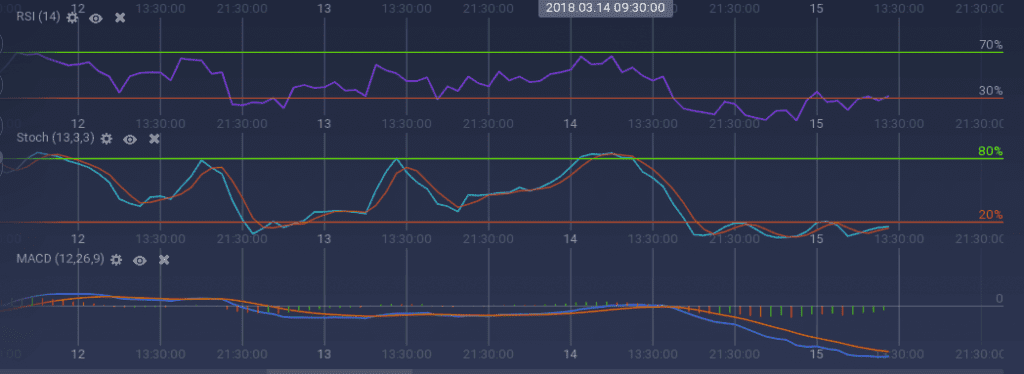
With a hint of support at the pit, the indicators are trying to be a little optimistic, but the dominating bear has become an obstacle. Though overselling zone, Stoch is showing some signs of rebound, and RSI went up to 30 percent from 11 percent, a few hours back. Though MACD is not showing any sign of recovery, signs of stabilization can be seen in the curves.
Conclusion
The distrust among the traders can be easily observed with the high volume of selling orders. However, it might be a good opportunity for the traders to put some short-sell options instead of unloading their funds, as the earlier can generate a huge profit in the dips.

