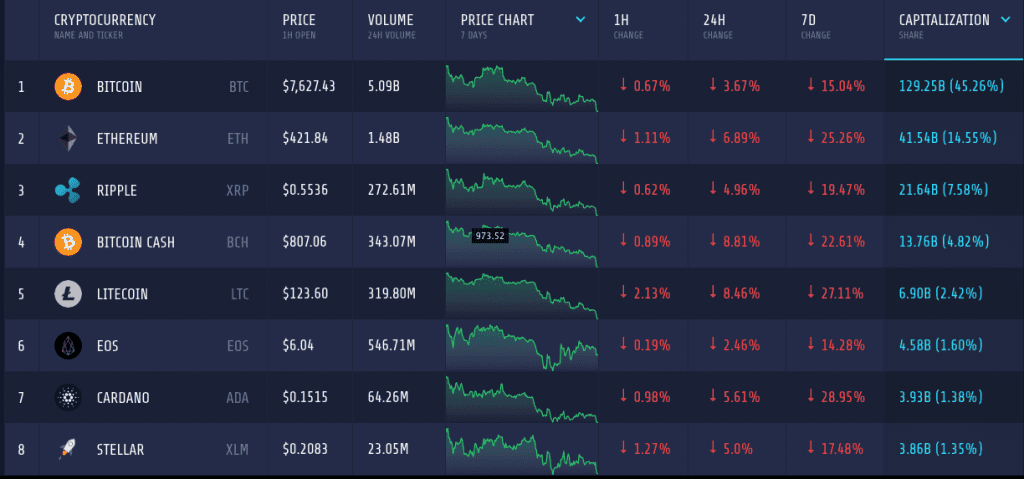
The cryptocurrency is going down again without any sign of near recovery. The total market cap has gone down to $284 billion – a loss of $15 billion in last 24 hours. However, a hand full of coins have managed to add some value in this bearish market.

Bitcoin
Bitcoin cannot maintain an upward rally to gain some of its lost value as the bear is constantly is pulling back the coin back. It is struggling to maintain a value above $9000 and as the ongoing FUDs in the market is fueling this distress. However, the market share of the original coin increased in the recent months as altcoins are bleeding even worse. With $129 billion in market cap, Bitcoin has captured more than 45 percent of the market – the second largest coin Ethereum holds only 14.5 percent of the same market. The dropping values also kept the traders at a distance as the 24 hours trading volume of the coin was little more than $5 billion.

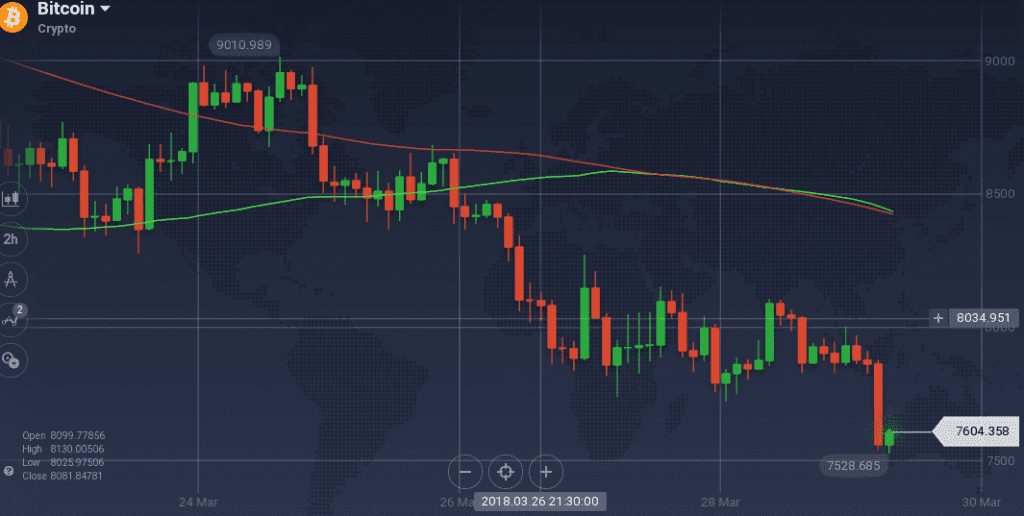
On the weekly chart, bear dominated the coin’s trajectory once it took over. However, it is to be noted that BTC was in a recovery mode initially as it touched $9000. The bear then resulted in a drastic fall of the coin. Various support at $8440 and $7830 tried to check the falling prices but all failed. The latter support held the coin for a significant amount of time, however, stiff resistance above $8100 did not allow the coin to boost any further.
Recently, the coin further slipped to drop below $7600, however, it is struggling to stay above that level.

Due to the recent drop in the prices of the coin, the already bearish indicators dropped further. Stoch and RSI went below the overselling zone, however, some signs of trend reversal can be seen in RSI. MACD is also signaling strong bear along the way. 100 and 200 SMA both are running by maintaining a very close distance in the curves due to the fluctuating prices.
Tron
Whichever way the market goes, some coin always stands out – this time it is Tron. Despite being the market falling, Tron managed to climb. The coin added mere 2 percent on the daily chart, but its weekly appreciation is more than 20 percent. This is also attracting a lot of traders to the coin as the trading volume was $323 million – an impressive number for a coin with $3 billion market cap in a bearish market.

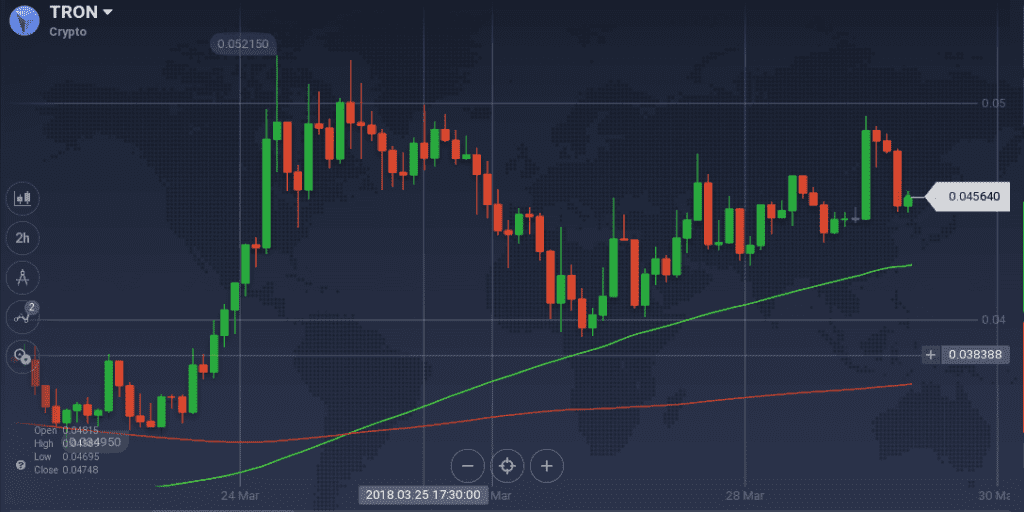
Tron maintained aggressive bull with two prominent upward trend line on the weekly charts. Though the coin pulled back in the midweek, the bull quickly took over and put the coin on a recovery trajectory. In the beginning, the coin jumped from $0.035 to above $0.050. However, the coin faced a strong peak resistance there. Though with support around $0.046, the coin tested the resistance for a while, it finally tanked to go below $0.039. That point, however, worked as a pivot and initiated a strong bullish trend, which the coin is still following. Currently, TRX is trading around $0.046 and it is maintaining its run above the trend line.

Though the coining is following an overall bull, the up and downs in the short trajectory put the indicators in confusion. Though RSI is bullish around 53 percent, Stoch is going down. MACD is also signaling bear, while the dominance of 100 SMA over 200 SMA is signaling bull.
Market Update
Nearly four months after Bitcoin futures hit Wall Street, trading giant Cboe Global is still working to allay U.S. Securities and Exchange Commission (SEC) concerns over Bitcoin Exchange Traded Funds (ETFs).
Bitfinex, the largest cryptocurrency exchange, has issued a statement regarding its restriction of Venezuela’s state-issued Petro Token (PTR).
France’s Finance Minister, Bruno Le Maire, is the latest high profile person to embrace the power of crypto as he realizes the benefits that virtual currencies offer.
Conclusion
In a dropping market, it is hard not to panic. However, for optimistic traders, it is the best time to buy some coins in discount, while pessimists can short the coins to gains from the dips.

