
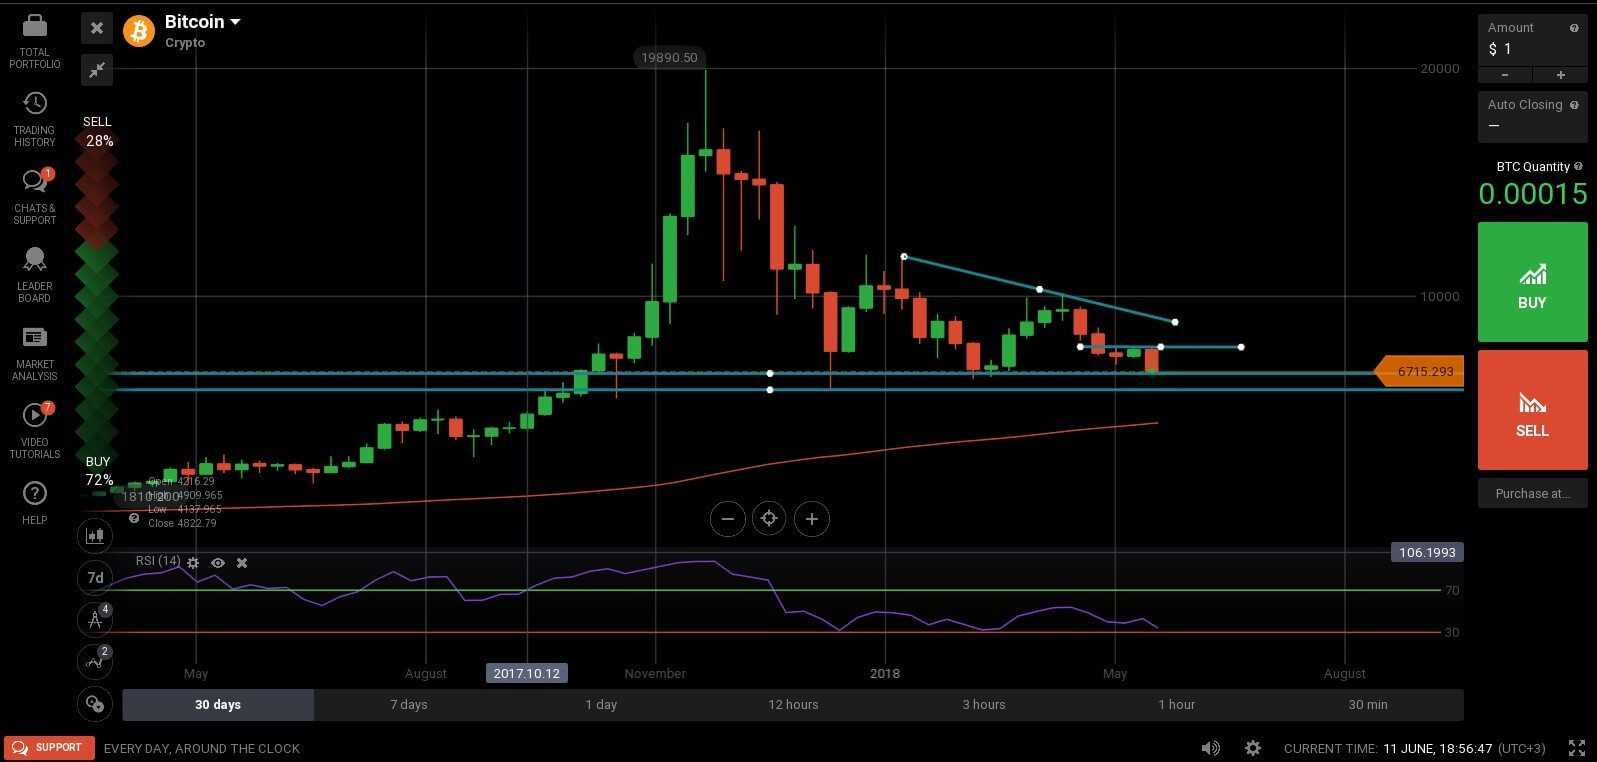
Bitcoin, the darling of the entire crypto world has been disappointing traders lately as we saw it dip further and further. After reaching a high of 10,098 US Dollars on the 6th of May 2018, it slid to a mere 6,700 USD at the time of writing.
We can only speculate about the reasons behind the recent slump, with some voices pointing to the CFTC investigation regarding trading manipulation, others turning to the recent Coinrail hack that resulted in an almost 40 Million USD loss. Either way, the waters are not calm in the Crypto world and apparently the big guys like Bitcoin and Ethereum are feeling the aftershock.
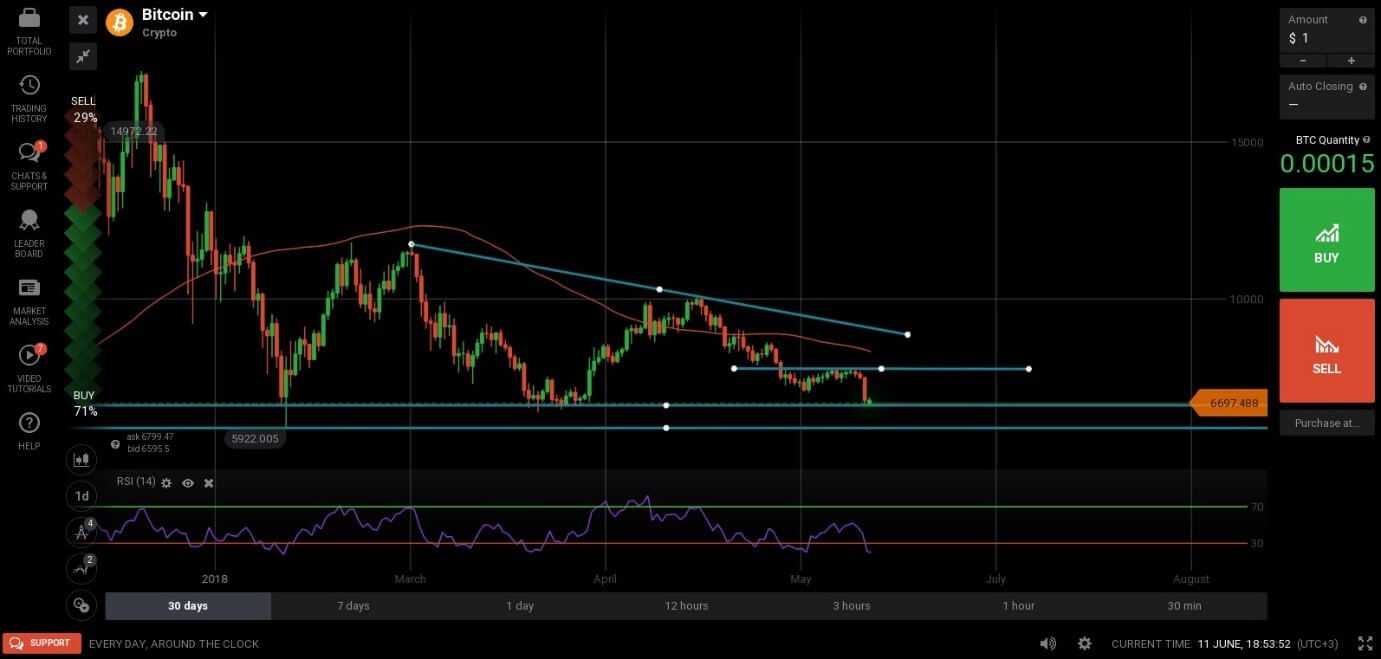
There’s blood in the streets, that’s true, but as you can see from the chart above, Bitcoin (BTC/USD) is approaching a very strong support zone located between $6,400 and $6,700, which may very well send it higher. However, if this key support is broken, we can expect to see even more downside, aiming for the next support, located around $5,922 (this year’s low). It must be noted that the Relative Strength Index has broken its 30 marks on a Daily chart, which means it has become oversold (thus increasing buy pressure) and this further supports a bullish view, with a jump higher from the current level or the next one.
To the upside the first target is located around $7,780 – $7,800 (technical minor resistance), with $8,000 in extension as psychological resistance. If these upside levels are broken, we can expect to see a move through the Simple Moving Average period 100 (Daily chart) and closer to the bearish trend line seen on chart.
Support zones: $6,400 – $6,700 as immediate bounce opportunity, followed by the yearly low at $5,922.
Resistance zones: Minor at $7,780 followed by psychological level at $8,000
Most likely scenario: Bounce at immediate support
Alternate scenario: Break of current support and a quick move into the year’s low
Ethereum’s journey south (and back?)
The reported hack on the Coinrail Exchange thwarted Ether’s shiny recovery started a day before and took ETH/USD to a low of $504 at the time of writing. However, considering that about 45 of the top 100 coins listed on CoinMarketCap are based on the Ethereum protocol, I don’t really see Ether in any major danger.
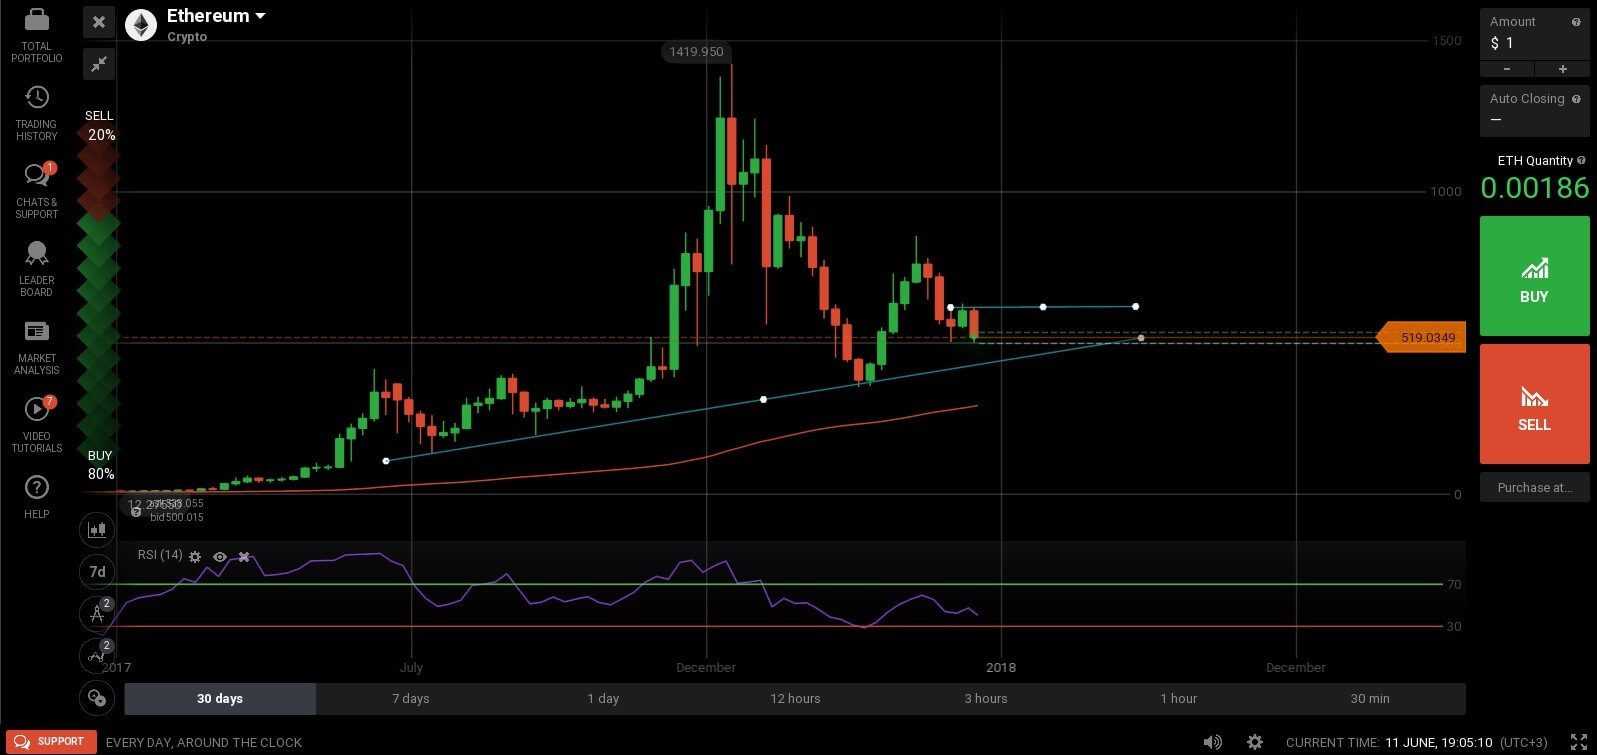
Strictly from a technical perspective, the pair is headed towards the bullish trend line seen on the chart above, with the Relative Strength Index (RSI) showing relatively strong momentum to the downside, without being oversold on a Weekly chart.
The previous touch of the trend line resulted in a bounce higher that failed to follow through towards the long-term top or to even threaten the crucial $1,000 handle. So, we are probably dealing with a breakdown and a move into the bullish trend line. As for resistance, we have a very fragile one between $625 and $635, followed by the top at $851
Support zones: the bullish trend line seen on the chart above, followed by the support around $360.
Resistance zones: $625 to $635, followed by the top around $850
Most likely scenario: drop to the trend line, followed by a bounce higher
Alternate scenario: break of trend line and move into the 100 period SMA (red line on chart)
