
The “digital Gold’ as some enthusiast call it is still waiting for a catalyst to push it higher. For the last couple of days, it has remained pinned near support, with a downwards bias that shows no signs of relenting.
The big picture
A new Bitcoin controversy is taking center stage, or rather an old one but with a new twist: a study conducted by a finance professor at the University of Texas reveals new information about the Tether (USDT)/ Bitcoin relationship. Apparently, the huge price increase seen late last year in BTC was due to massive Tether printing that was in turn used to buy Bitcoin.
Allegedly, every Tether is backed by one US Dollar and if this is the case, then we cannot consider it price manipulation or an artificial rise. However, there have been rumors that USDT (Tether dollar) is not fully backed by USD but that hasn’t been proven. The whole thing seems inconclusive, but the FUD is kicking in and every rumor is exacerbated.
Deciphering the technical chart

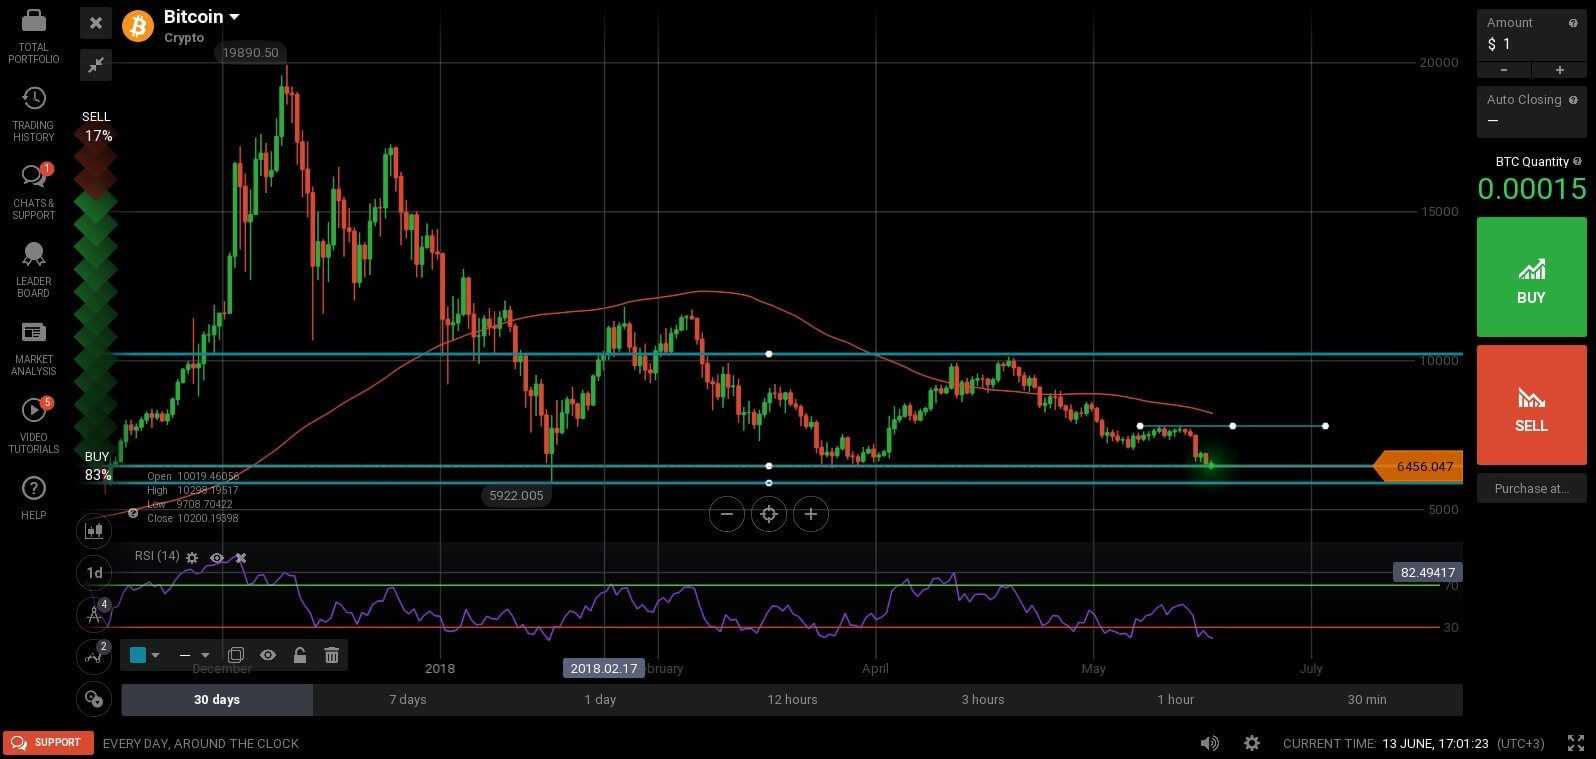
Not much has changed since our last Bitcoin update. The chart is clearly bearish in the medium term, but the pair is sitting on a strong support located between 6,400 and 6,700. On top of this, the Relative Strength Index on Daily and lower charts is deep in oversold territory (below its 30 mark) and showing signs of reversal. All of these are bullish signs in a downtrend, so we could see a bounce higher. The catch is that this would be considered a retracement, not reversal.
Support zones: $6,400 to $6,700, followed by the yearly low at $5,922
Resistance zones: $7,800, followed by the psychological level at $8,000 (which was previously support)
Most likely scenario: Bounce higher to meet the bearish trend line seen on the chart or at least into $6,900 area
Alternate scenario: Break of current support and move into the yearly low at $5,922
Ripple keeps on keeping on
Ripple’s Chief Cryptographer, David Schwartz, spoke recently to CNN’s Ivana Kottasova about his vision of a world where money moves as fast as data is moving today. Ripple (XRP) is supposed to fuel that dream and is a cryptocurrency with a very strong team and active team behind the curtains. Regardless, the coin is still dropping against the US Dollar and cannot get back the shine it had in 2017 when it was the best performing crypto currency.
Deciphering the technical chart
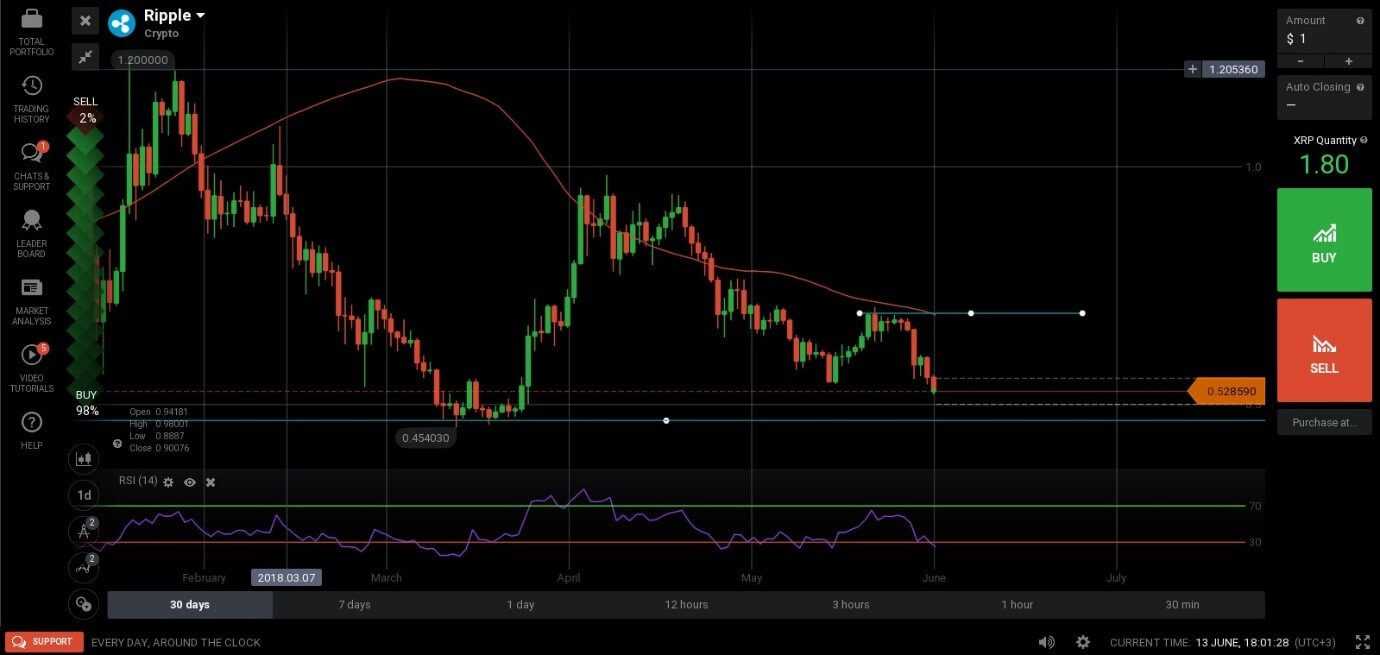
After creating a high at $0.7030, XRP dipped and broke the previous support around $0.5470 so now the first target is likely the key support zone around $0.4600 – $0.4700. The Relative Strength Index is just approaching its 30 marks, but it is not yet oversold, so there is still room to drop, especially if price remains below the previous support.
Support zones: $0.4600 – $0.4700
Resistance zones: $0.6900 – $0.7000 and the 100 period Simple Moving Average
Most likely scenario: A continuation of the recent bearish move, into $0.47xx – $0.45xx area
Alternate scenario: Rise towards the resistances mentioned earlier; however, these will not be touched in the very short term.
