Balance of Power Indicator (BOP) is a technical analysis instrument that measures the market power of buyers and sellers at any given moment. It can help you determine the prevailing market sentiment. When using this indicator, you will be able to:
- Better identify the prevailing trend,
- Determine entry and exit points,
- Determine overbought and oversold positions.
Balance of Power indicator can be used in any timeframe and for any asset type, including Forex, stocks, indices and ETFs. You may give BOP a try if you need a complementary tool that could help you make sound trading decisions.

How does it work?
Balance of Power may look just like your average oscillator, but it is not! It doesn’t mirror the performance of the asset with upward and downward swings. It follows the logic of its own.
BOP is calculated according to the following formula:
Balance of Power = (Close price – Open price) / (High price – Low price)
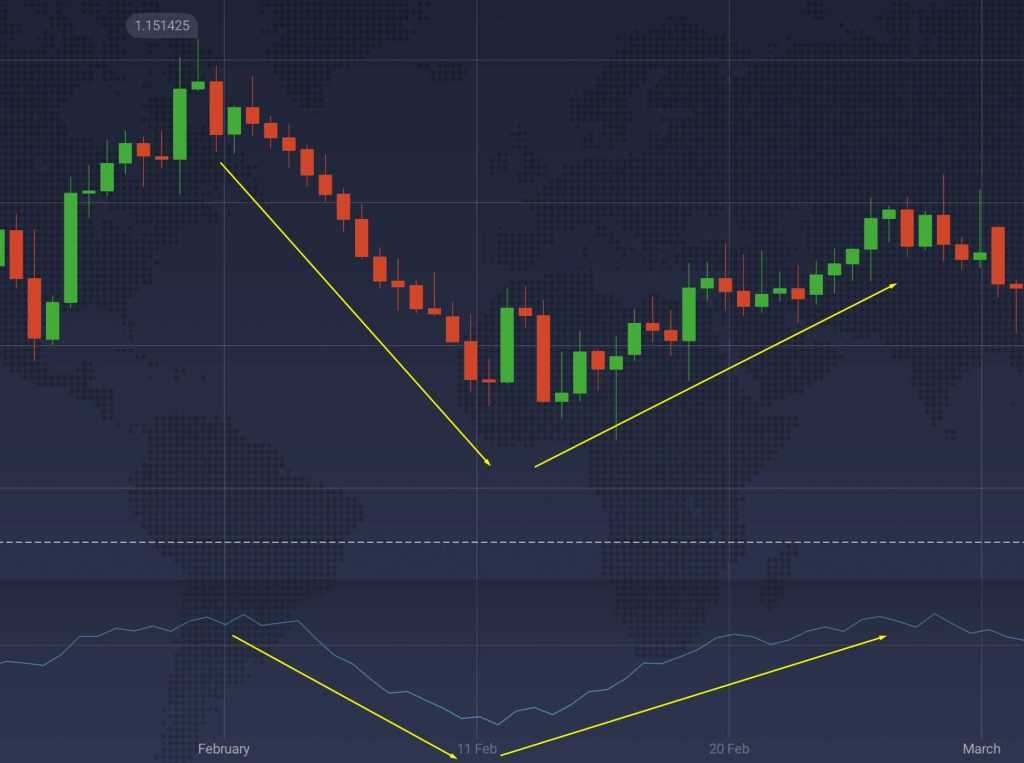
When the indicator is above the zero line, it points to the prevalence of positive market sentiment. When the indicator is below the said line, sellers have an upper hand (at least, according to the indicator). That’s the most important principle behind Balance of Power. All in all, it is an interesting version of the indicator that traces dominant market conditions in real time.

How to use Balance of Power indicator in trading?
As you probably already know, oversold and overbought levels are used to determine those moments that can boast a higher probability of a trend reversal. Indeed, no asset can grow forever. What has grown has to go back down, so is the law of the market. By identifying overbought/oversold positions, you will identify periods when the trend reversal is more likely, thus getting an upper hand in trading.
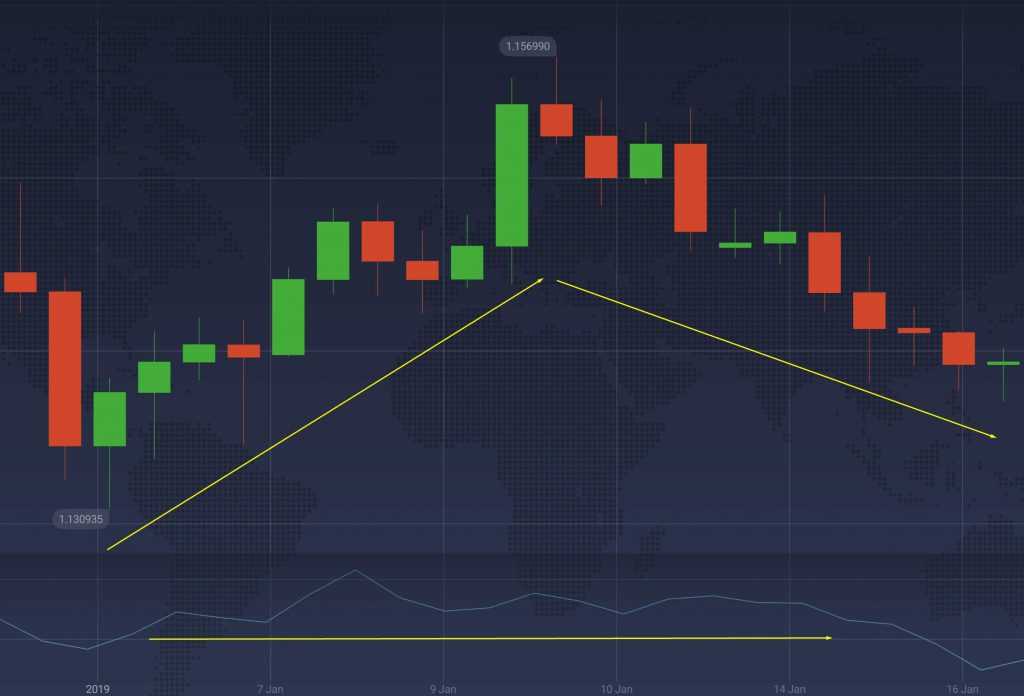
However, it is worth remembering that the information provided by this indicator is not enough to use on its own. Buying and selling pressure, though helpful, is not directly connected to the trend. Buyers can have an upper hand (according to BOP) and the asset will still lose in price. The opposite can also be true: sellers can have an upper hand (according to BOP), and the asset will still appreciate. Use this indicator carefully and combine it with other technical analysis tools: oscillators, trend-following and momentum indicators.

☝️
But it is not always true. Due to its peculiar nature, Balance of Power can be above or below the zero line regardless of the prevailing trend.
Balance of Power can provide a confirmation to other indicators in accordance with the rules, mentioned above. When another technical analysis indicator points to an emerging trading opportunity, you may use Balance of Power to determine what other market participants think about the asset price, and whether it should go up or down. When using unrelated indicators to confirm each other’s signals, it might be easier to receive an unbiased technical summary.
How to set up?
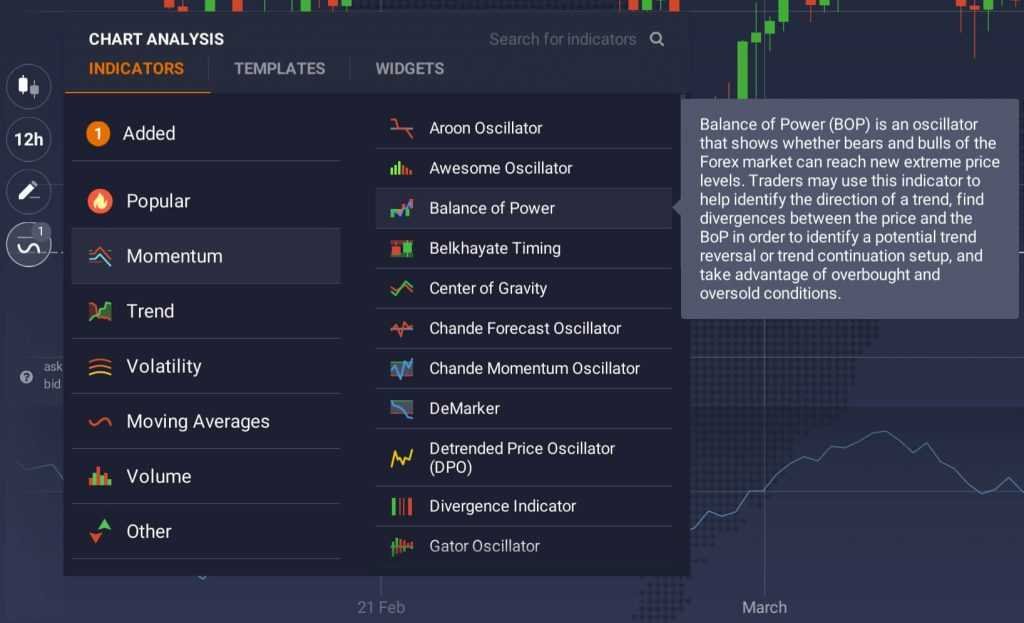
Setting up the Balance of Power indicator is easy. Go to the ‘Indicators’ by clicking the corresponding button in the bottom left-hand corner of the screen.
Go to the ‘Momentum’ tab and choose Balance of Power from the list of available indicators.

Click ‘Apply’ without changing the settings. Alternatively, adjust the number of periods and the moving average type. The higher this number of periods, the less sensitive the indicator will become. The lower the number of periods, the more sensitive it will be (the number of false alarms will increase, as well). The moving average type can also affect the readings of the indicator.
The indicator is ready to use!

