
The Aussie Dollar has declined this week following a somewhat dovish RBA statement and a stronger USD. After gapping down on Sunday night, price rallied to around 0.7650. Price has fallen since Monday, however, and broke through the key support level between 0.7550 and 0.7530. This level held in late November, and was a swing low on the move higher back in June this year. A break below this level opens the door to 0.74 or lower, however higher prices over the longer term are forecast on an eventual change in RBA policy. Long positions could be built from current levels; however, traders could also wait for a reversal signal before entering.
On the daily chart we can see the price action described above. The AUD/USD has been in a downtrend since September, falling from highs of 0.81 to current levels. Interestingly, we see some divergence appear here between the RSI and price. The RSI is a useful indicator in these situations, and gives us an insight into the strength of the current move. Price has just broken support, however we can see the RSI is not making a new (or equal) low, suggesting that this move down may not be sustained.
On a macro level, it’s unlikely that the RBA will cut rates further, while the US Fed policy and rate trajectory is fairly well known. There’s opportunity on this pair to the upside, if strong data from Australia suggests even a hint of a rate rise, this pair will rise dramatically. That’s a longer-term play, however getting long at these levels, with a nice risk/reward, could be profitable into the new year should the RBA shift its policy even slightly.
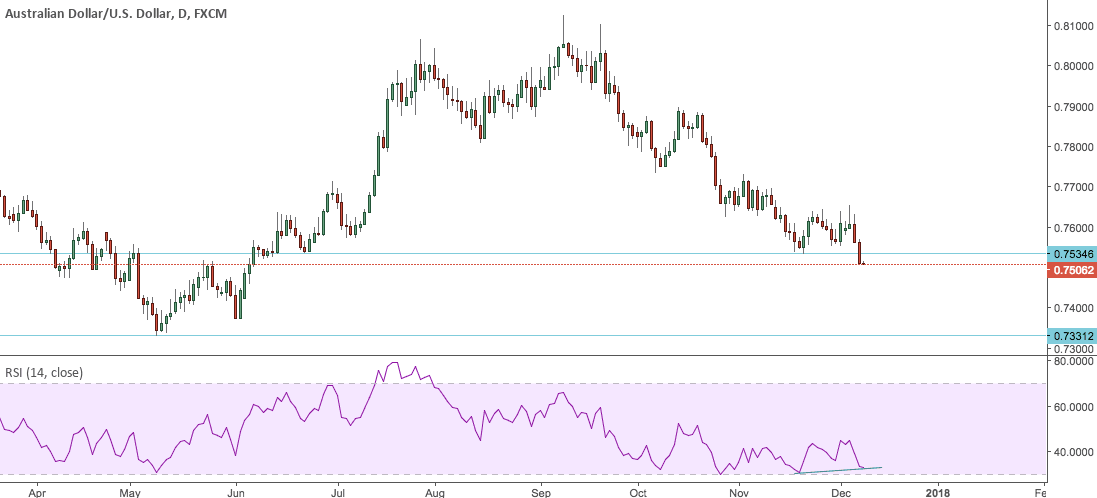
Trade idea: Look for long opportunities on a trend reversal. Stop under be 0.7330, with a target of 0.81.
