Today we take a closer look at a trading strategy that anyone can use. What is even better, it can work on any asset and any time frame. Already interested? Then don’t hesitate to learn more about the different aspects of the Bladerunner strategy and how to apply it in practice.
The strategy is called the Bladerunner because it cuts the price action in two like a blade. For this strategy, you won’t need any off-chart indicators (i. e. indicators that are located below the price chart) like MACD, Awesome Oscillator or Stochastic. There is only one indicator that is absolutely essential when trading with the Bladerunner strategy, and it is a 20-period EMA (exponential moving average). More on the nature of moving averages here.
Support and resistance levels also play an important role when implementing this strategy. Note that the Bladerunner, as most other strategies out there, should be adjusted to the time of the day you trade.
The logic behind the strategy is quite simple. If the price is above the EMA and retests it, the continuation of the upward movement can be expected. If the price is below the EMA and continues to stay below, it can be expected to continue its downward movement. When the price moves through the EMA and the candle closes on the other side of the curve, the trend reversal can be expected. In other words, the EMA plays the role of a moving support/resistance level.
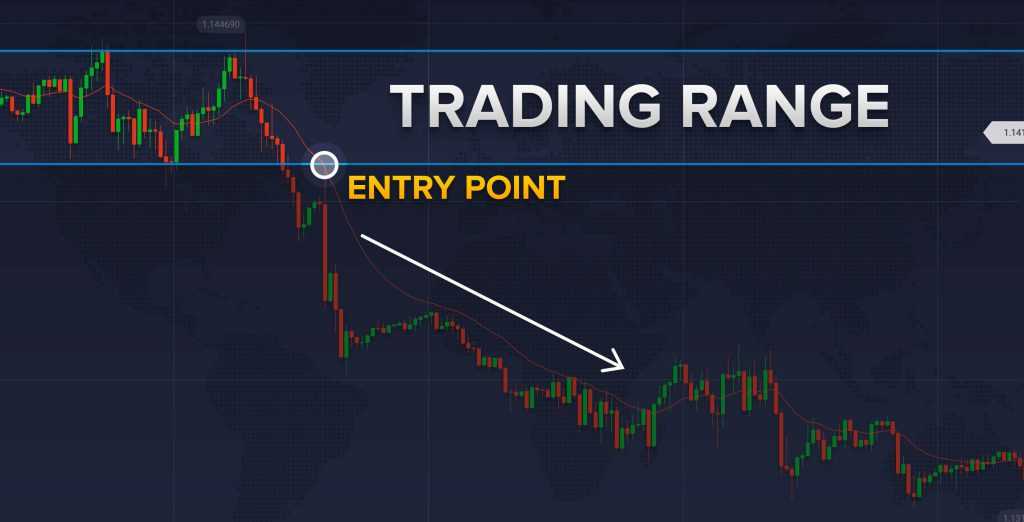
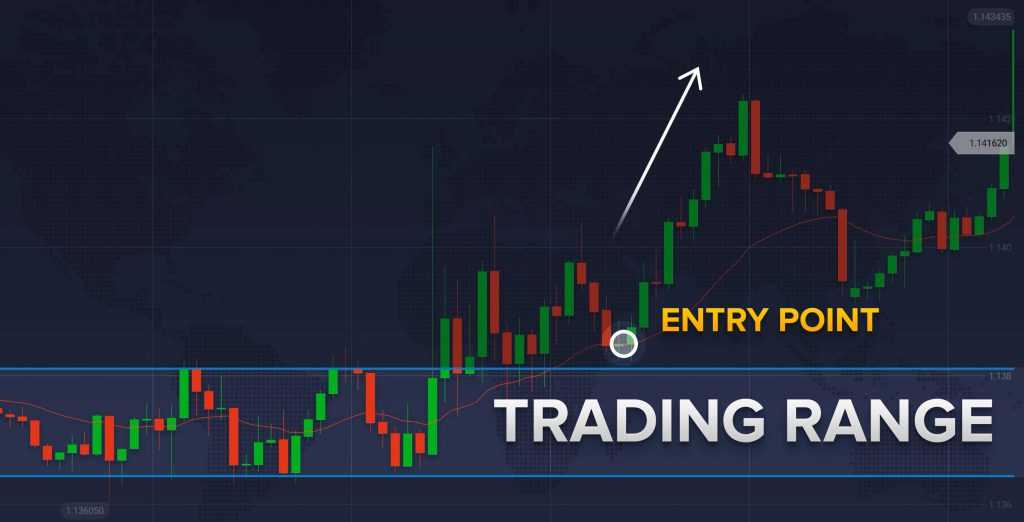
In order to make an entry, the trader first has to make sure that the price has left the established range, in which the asset was traded for a substantial period of time. Secondly, the price also has to retest the EMA successfully: not only does the candle has to close above/below the EMA, the price has to bounce off the said line and continue moving in the same direction for a signal to be considered confirmed.

It may also be wise to consider using a stop-loss order when using the Bladerunner. Thus, you will be able to manage the risk when the signal, received from the trading system, turns out to be false. Other indicators, though not essential, can be added to the trading system in order to decrease the number of false signals.

This is an example of how to use this strategy in practice. After spotting an asset that is traded in a certain range, you may apply a 20-period exponential moving average to the price chart. Then, wait for the price action to leave the said range. If the asset price is out of range and retests it, you could consider opening a long position (buy) in case of a bullish trend and a short position (sell) in case of a bearish trend. And this is how you trade the Bladerunner strategy.
Please note that no strategy can guarantee 100% of winning deals. All strategies can work under certain circumstances but will ultimately fall when market conditions change.

