
If you’re a trader who struggles to spot profitable candlestick patterns, fear not! We’re diving into three powerful candlestick patterns: the Bearish Engulfing, the Shooting Star candle, and the Triangles. All three patterns are considered great candlestick patterns for binary options, they are easy to spot on the chart, and provide valuable trend insights.
1. The Bearish Engulfing Pattern
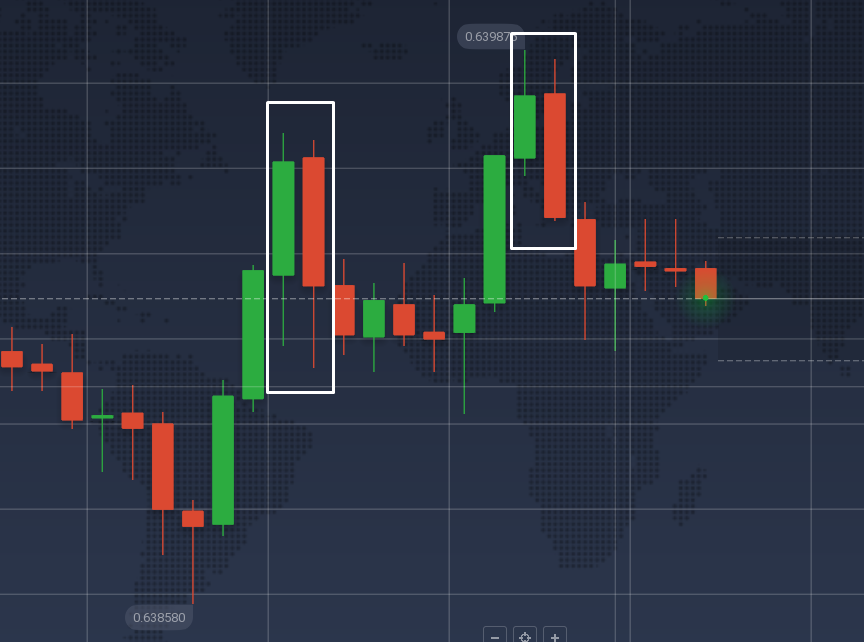
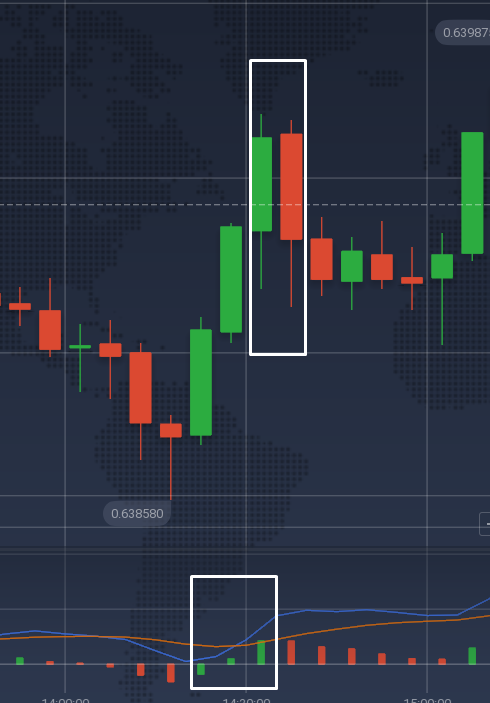
This pattern indicates a potential shift from a bullish to a bearish trend. It tells you that the buyers (bulls) are losing control, and the sellers (bears) are taking over.
How to identify this pattern?
Imagine the market is in an uptrend, and everything seems to be going smoothly. Then, you notice a green candlestick followed by a red one that completely engulfs the previous candle. Congratulations, you’ve spotted a Bearish Engulfing pattern!
- First candle: A green candlestick indicating upward movement.
- Second candle: A red candlestick that opens higher and closes lower than the first, engulfing it entirely.
How to trade Bearish Engulfing pattern?
Here are some ideas on how you may use one of the best candlestick patterns for binary options in your trading routine.
1. Look for confirmation: wait for secondary indicators like the MACD and Stochastic Oscillator to confirm the trend change.
2. Take profits early: if you already have some open long positions, consider closing some of them in profit before the trend shifts.
By understanding how to trade the Bearish Engulfing Pattern, you can effectively use it as one of the best candlestick patterns for day trading or even as a candlestick pattern for swing trading.
2. The Shooting Star Candle Pattern
The Shooting Star candle indicates that buyers pushed the price up during the day, but by the end, sellers took over, and the price closed near its low. This signals that the uptrend might be losing steam.
How to identify it?
You’re watching an asset rise, and suddenly, a candlestick forms with a small body near the low and a long upper shadow. This is a Shooting Star candle, a sign that a reversal might be imminent.
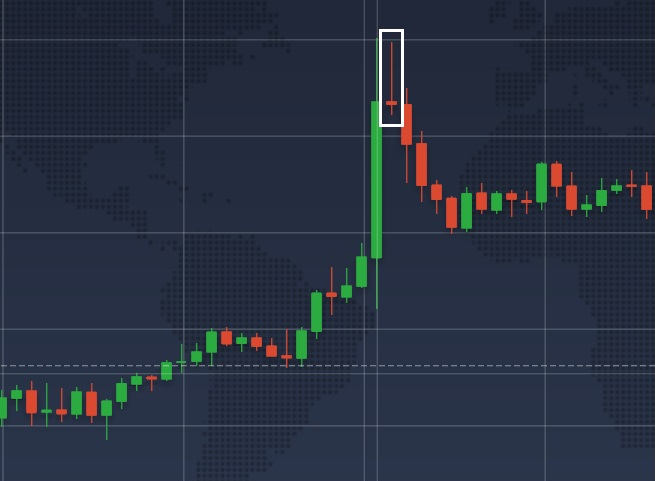
- Small body: Near the day’s low.
- Long upper shadow: At least twice the length of the body.
- Little to no lower shadow: The body is at the lower end of the range.
Due to its distinctive shape, the Shooting Star ranks high among the best candlestick patterns for binary options and is considered one of the best candlestick patterns for day trading.
Trading tips
- Wait for confirmation: Ensure the next candle confirms the reversal by closing lower.
- Do not confuse the Shooting Star with the Inverted Hammer pattern: Both patterns have long upper shadows and small real bodies near the low of the candle, with little or no lower shadow. The difference is context. A shooting star occurs after a price advance and marks a potential turning point lower. An inverted hammer occurs after a price decline and marks a potential turning point higher.
- Short selling: If confirmed, it might be a good time to consider short selling.
- Volume matters: Higher volume during the Shooting Star candle formation strengthens the signal. Feel free to enable the Volume widget in the Widgets tab of the IQ Option platform.
3. The Triangle Pattern
Traders watch 3 types of triangles. In all three cases, the pattern is formed by converging trend lines, the difference is in how those lines converge.
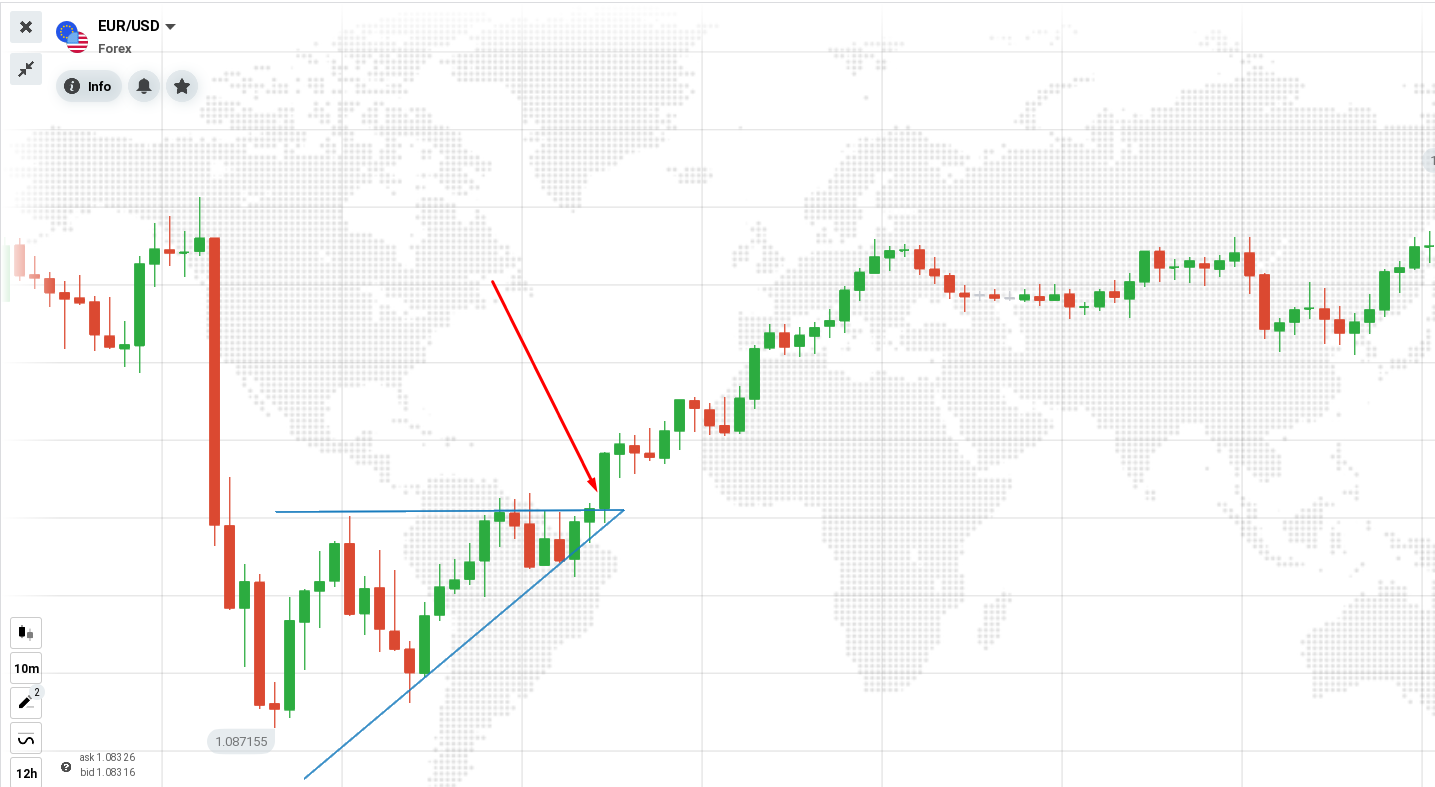
Ascending (Bullish) Triangle
Imagine a rising support line bumping against a horizontal resistance line. That’s your ascending triangle. This pattern usually indicates that prices will continue to go up within a briefly interrupted bullish trend. A signal to buy comes when the price breaks above the resistance.
Trading tips
- Ensure you have at least 2 higher lows to validate the structure.
- Enter a trade at the close of the first candle that breaks above the resistance.
- Place your Stop Loss at one of the previous lows, depending on how aggressive your strategy is.
Descending (Bearish) Triangle
Flip the ascending triangle upside down, and you get the descending triangle. Here, you have a horizontal support line and a descending resistance line. This is a bearish continuation pattern, often leading to price drops once the support line is broken. It’s the market’s way of saying, “sell now or regret later.”
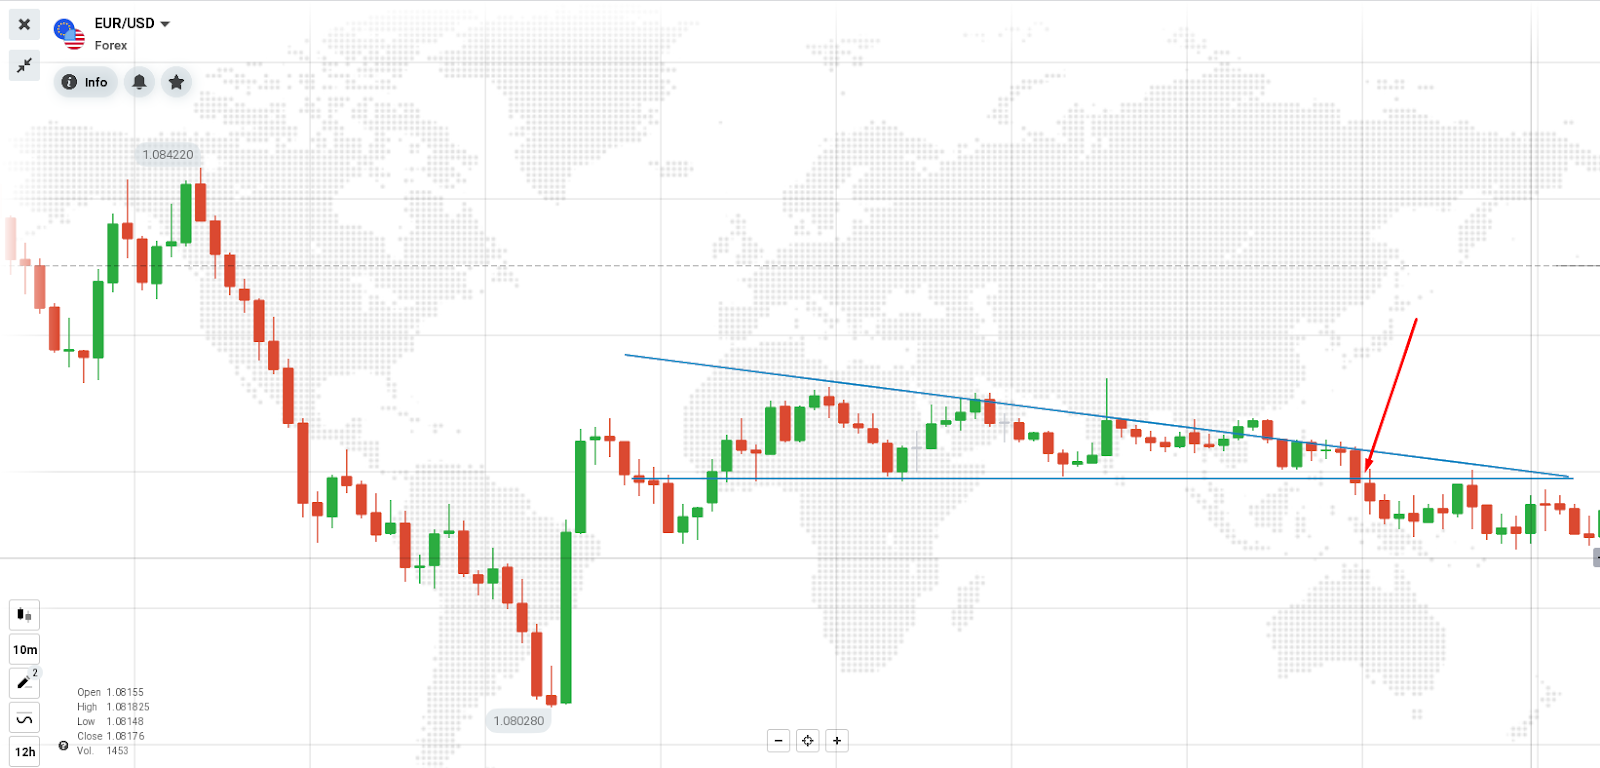
Trading tips
- Ensure you have at least 2 lower highs to validate the structure.
- Enter a trade at the close of the first candle that breaks below the support.
- Place your Stop Loss at one of the previous highs.
Symmetrical Triangle
The symmetrical triangle forms when both the support and resistance lines are sloping towards each other, creating a cone shape. This pattern doesn’t tell you much about direction — it just says a big move is coming. It’s like watching two evenly matched wrestlers. Once the price breaks out, traders jump on the new trend, whether it’s up or down.
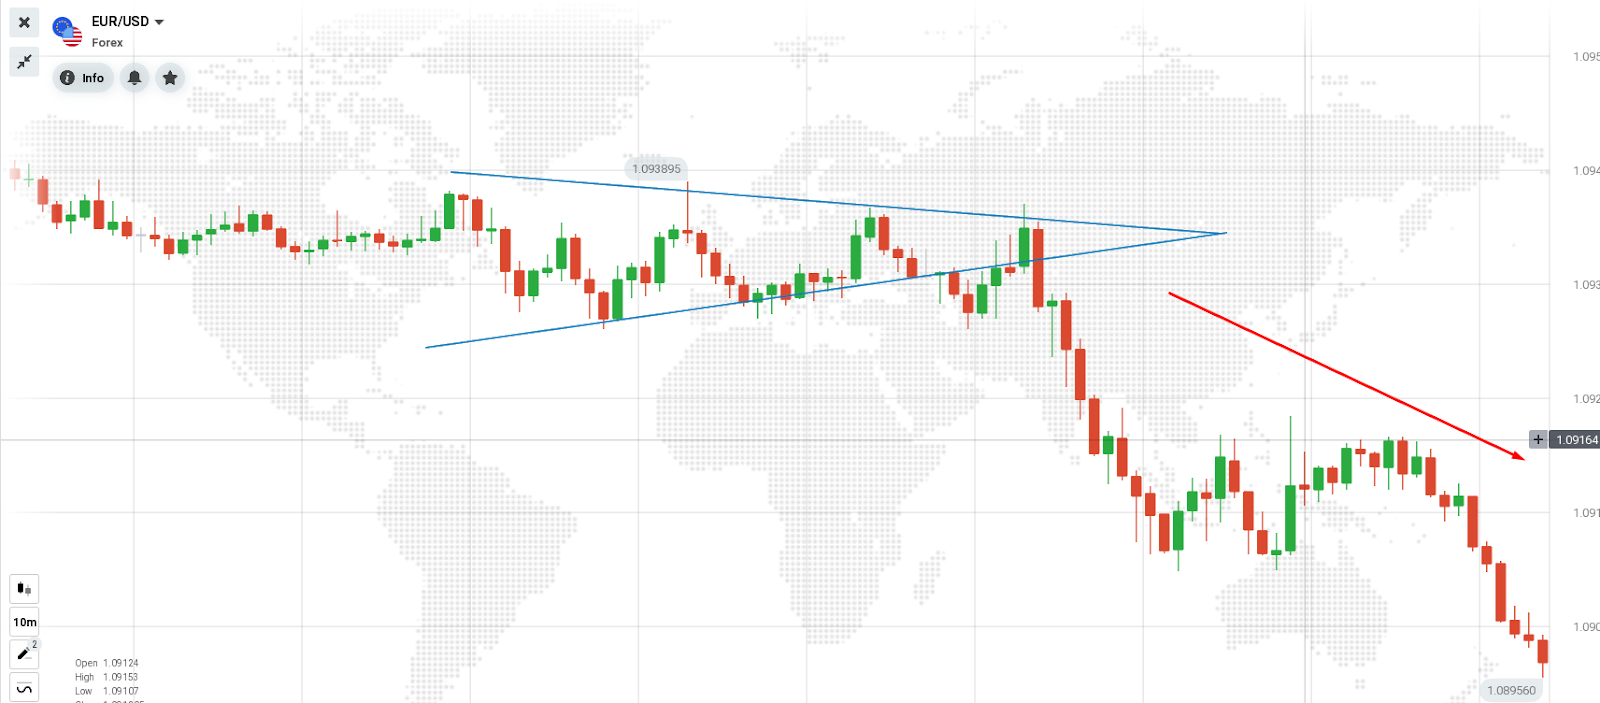
The pattern is typically focused on an upcoming event such as key data, a central bank meeting or an earnings report, so identifying potential catalysts can be a huge help in trading it.
Conclusion
We explored three reliable candlestick patterns: the Bearish Engulfing, Shooting Star candle, and Triangles. The Bearish Engulfing signals a potential bearish reversal, the Shooting Star candle indicates a possible top in an uptrend, and the Triangles mark a trend continuation or signal a reversal at an early stage. Whether you’re looking for candlestick patterns for binary options, the best candlestick patterns for day trading, or a candlestick pattern for swing trading, these three will make a huge difference when added to your analytical toolset.
