The ADX (Average Directional Index) is a trend strength indicator – a technical analysis tool used to measure the trend strength. This means that it may indicate whether the trend is upward, downward or weakening before the upcoming price movement.
To comprehend how to use the ADX indicator, it’s important to first learn the basics. This indicator consists of 3 lines: the main line (yellow), the +DI (green line) and the -DI (red line).
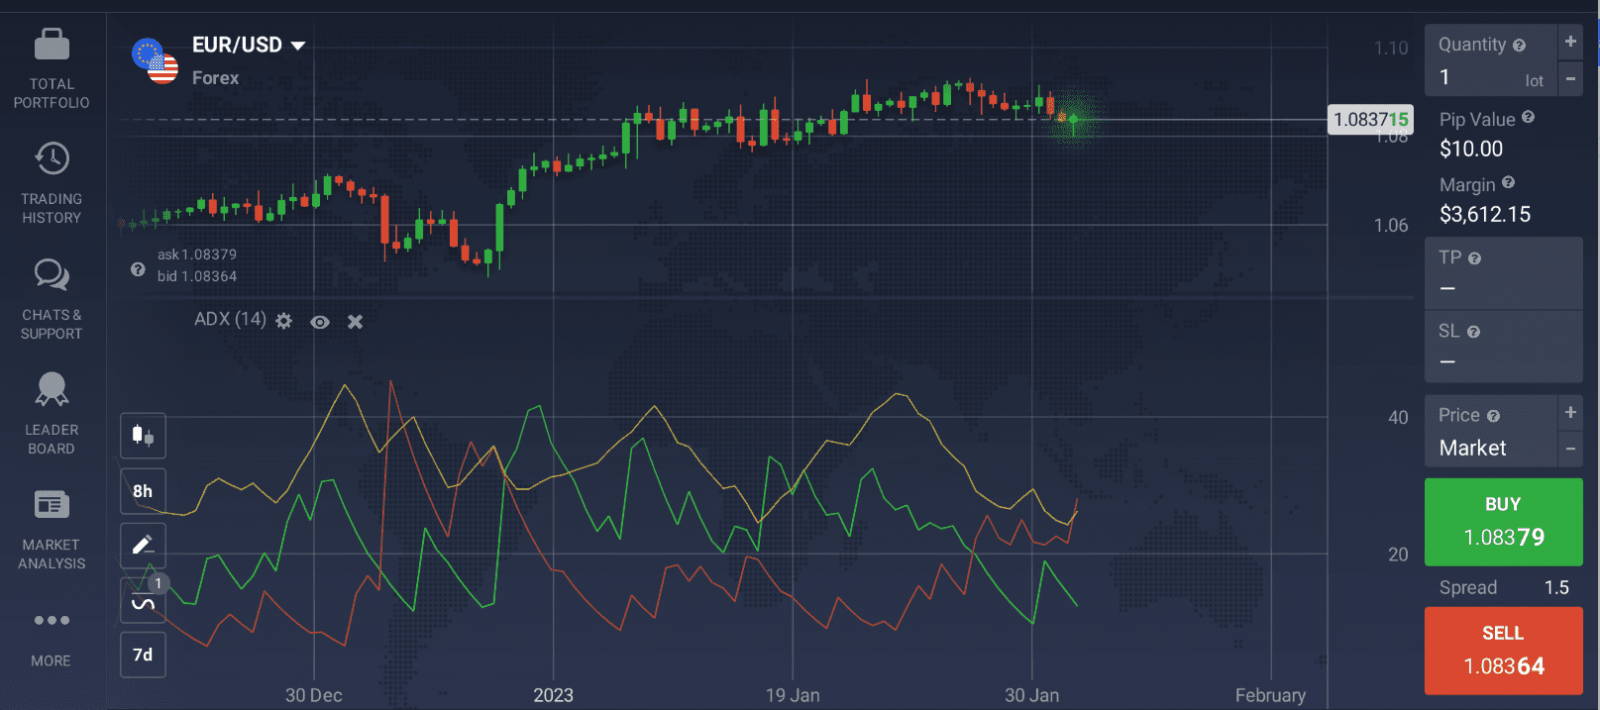
The ADX is considered a powerful trend strength indicator, so the main line shows the overall trend strength.
✍️
Together, they form a trading system that may help determine both the trend direction and the trend strength.
How to Read the ADX?
To figure out how to use the ADX indicator in trading, you should first learn to understand its readings.
The ADX values range from 0 to 100, with 0 being an equivalent of the absolutely flat market and 100 — a very powerful trend.
| ADX Value | Trend Strength |
| 0-25 | Absent or Weak Trend |
| 25-50 | Strong Trend |
| 50-75 | Very Strong Trend |
| 75-100 | Extremely Strong Trend |
✍️
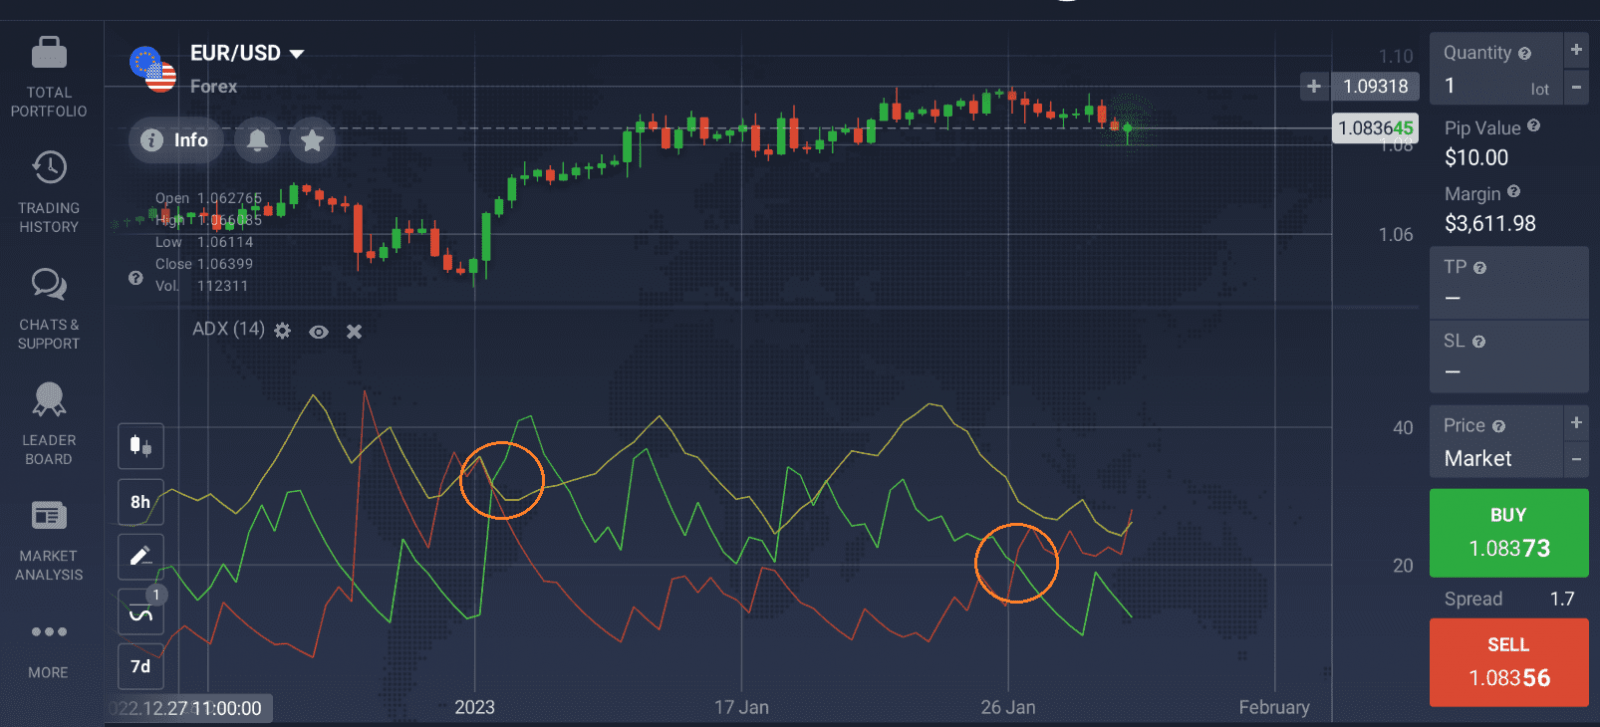
Alternatively, when the -DI line is higher than the +DI, it may point to a bearish market sentiment.
Sometimes the +DI and -DI lines cross, which may point to an upcoming trend reversal. This information may be used identify the optimal moment to enter or exit a deal.
It is important to understand that the ADX (the yellow line) demonstrates only the trend strength and not the direction of the trend. Trend direction can be determined by looking at the +DI and -DI (red and green lines) instead.
How to Set Up the ADX Indicator?
There are different ADX period settings that you may choose depending on your trading approach. To find out how to set up the ADX indicator, let’s take a look at the main steps.
1. Go to the ‘Indicators’ tab in the bottom-left corner of the screen.
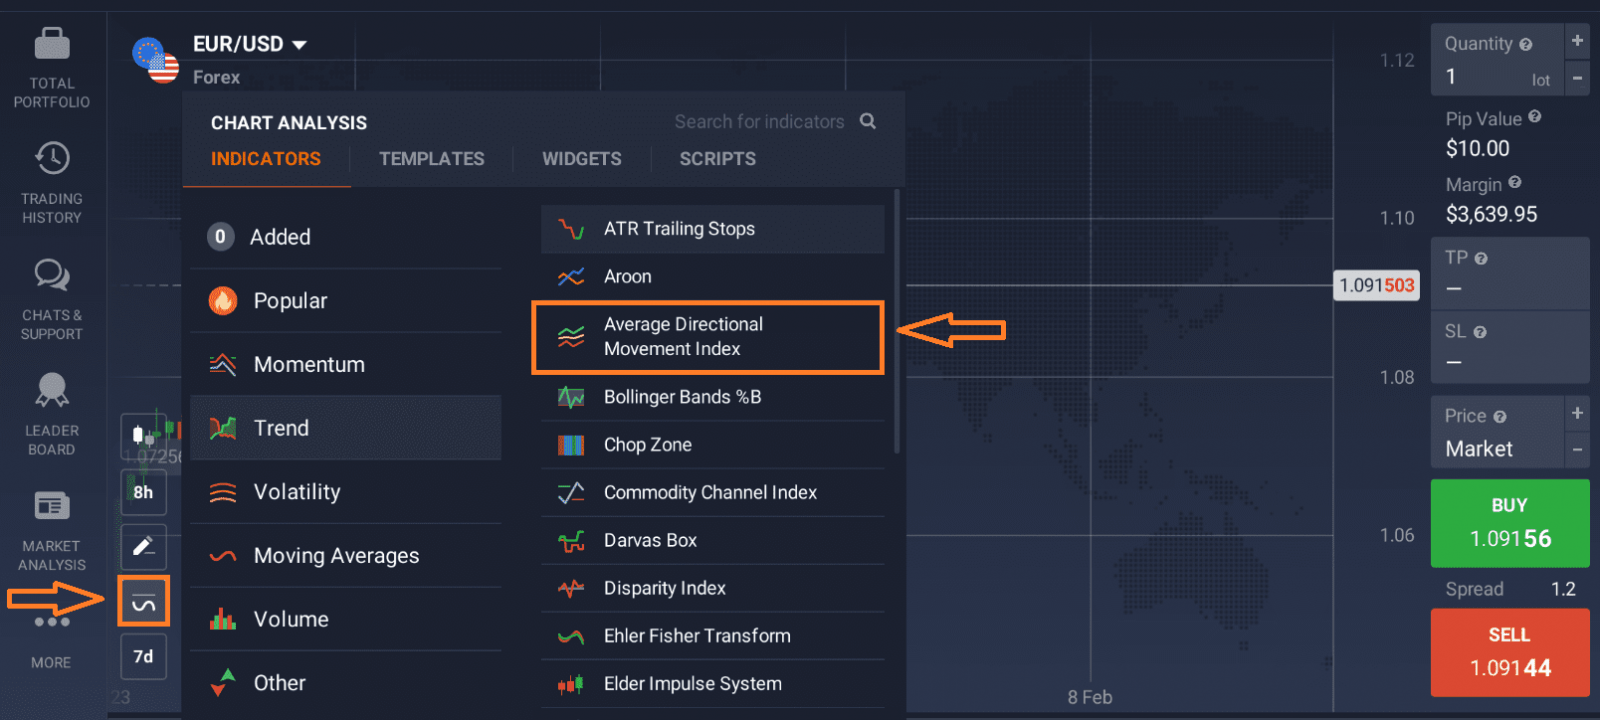
2. Find the ADX indicator in the ‘Trend’ section among other similar tools.
3. Now you may either apply the standard parameters or customize them to your liking. For instance, you may choose the ADX period settings and adjust the colors of all 3 lines. Note that by increasing the ADX period settings you may reduce the indicator’s sensitivity and at the same time improve its accuracy.
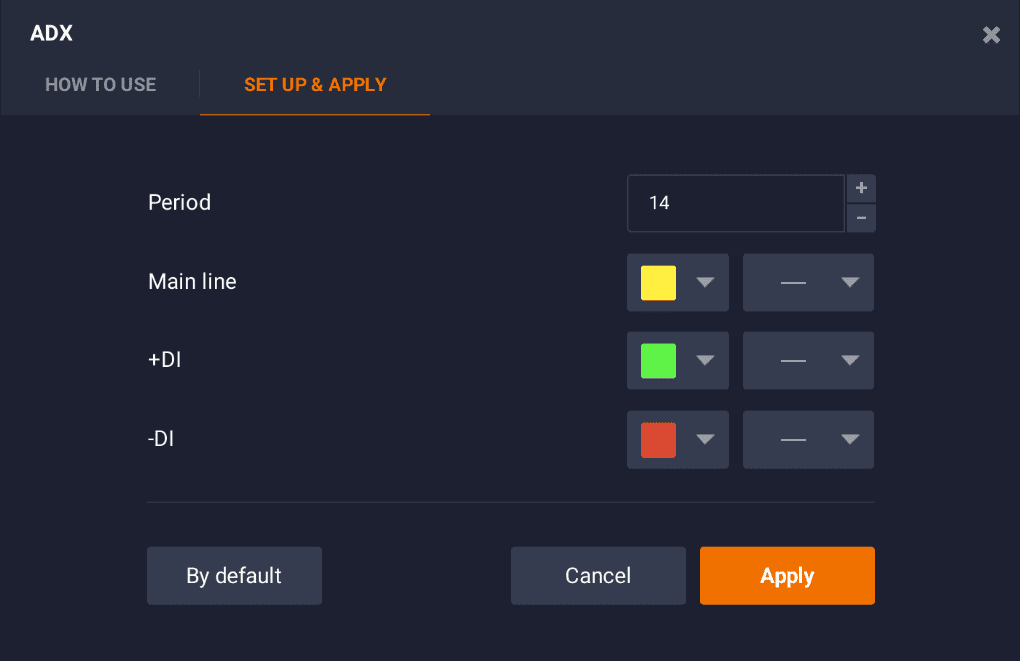
4. The ADX indicator set-up is finished and you may start trading.
Is ADX a Good Indicator?
The Average Directional Index is a great technical analysis indicator that, combined with other indicators, may become a useful tool in the hands of a trader. Accompanied by +DI and -DI lines, it is not only capable of predicting the trend strength, but also the trend direction.
As any other indicator, however, it should be used with caution and double-checked on different timeframes. No indicator is capable of providing accurate signals 100% of the time. The ADX may sometimes be lagging behind the actual trend and can, therefore, provide outdated information.
What is the Best Combination with the ADX Indicator?
The ADX can be combined with other indicators that show the direction of the future price movement. One such combination is ADX + Parabolic SAR.
SAR stands for “stop and reverse” and may help identify upcoming trend reversals. When using SAR alongside the +DI and -DI lines, traders may be able to confirm the trend and identify potential trend reversals.
Let’s take a look at an example of an ADX indicator combo. Currently, the +DI line is above the -DI line on the EUR/GBP price chart, which may point to an uptrend. The ADX line that measures the strength of this uptrend has climbed over the value of 50, indicating a very strong trend. Finally, as the parabolic SAR indicator’s dots are located below the price, it also points to an uptrend.
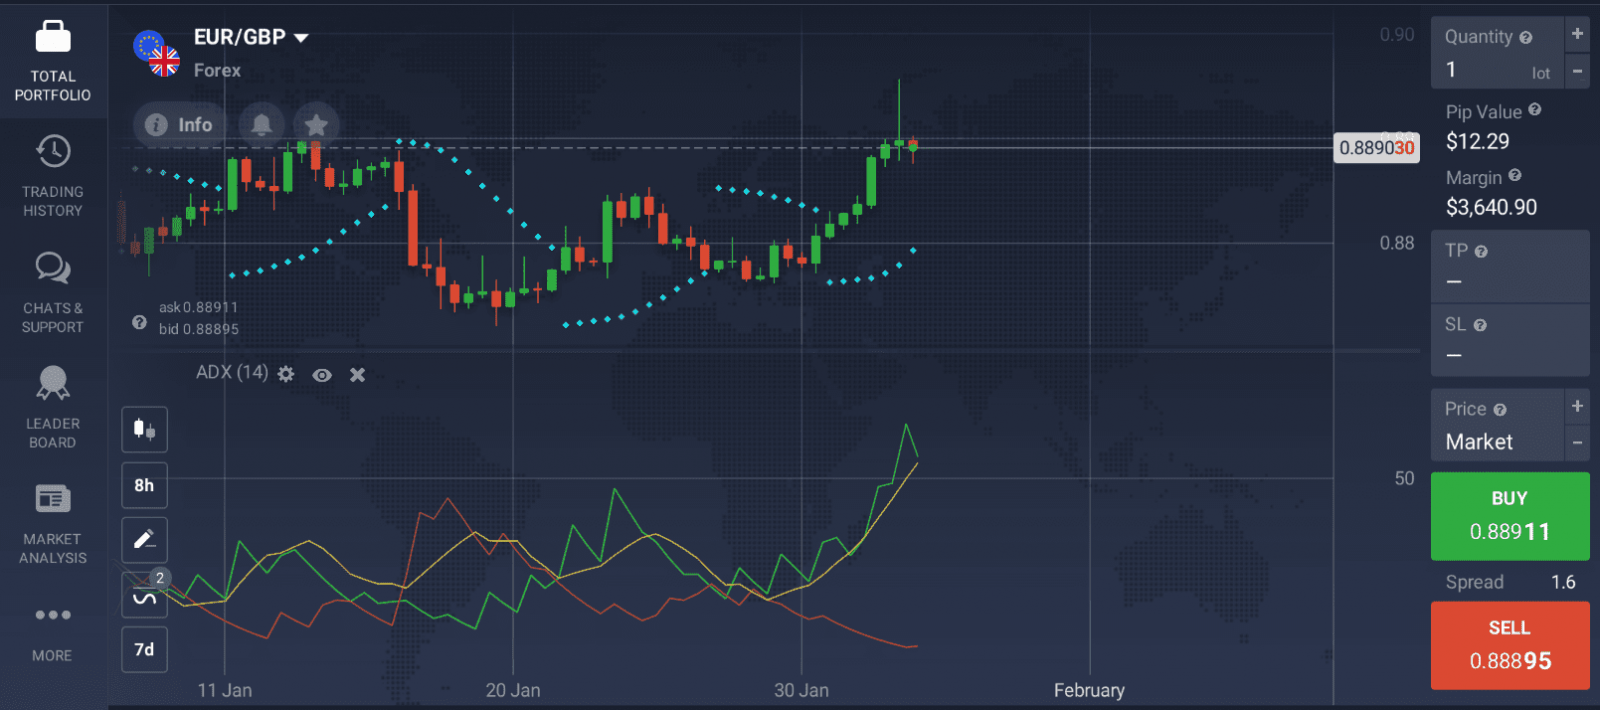
Once the SAR moves above the price, it may indicate an upcoming trend reversal. By monitoring this indicator and comparing its signals with the trend strength of the ADX values, traders may catch upcoming trend reversals and decide on the optimal time to enter the market.
