Candlestick patterns are popular tools for technical analysis of assets. By observing different patterns, traders may catch potential trend reversals and pick the optimal time to enter or exit a deal. We have collected a list of patterns with examples to help traders understand these instruments and learn how they may be applied in trading.
What Is a Candle in Trading?
Candlestick patterns are formed by a combination of candles, offered in the form of a candlestick chart in the traderoom. Main parts of the candle are the body, the upper shadow and the lower shadow. The body of a candle indicates whether the closing price was higher (if green) or lower (if red) than the opening price. Candle colours may be modified in the traderoom to fit a trader’s preference.
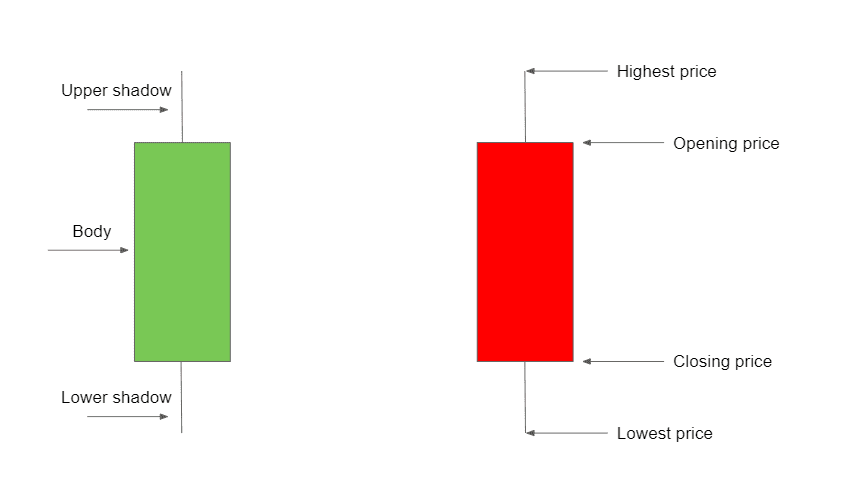
A candle shows price fluctuations of an asset over a certain period of time. For example, if a trader chooses the 30-minute timeframe, a candle will show the data over the past half-hour. The candle shadow provides information about the highest and the lowest prices during this period.
Types of Candles for Trading
Trading with candlesticks involves observing candle patterns and using them for asset analysis. The key is not to analyse candlesticks per bar. It’s important to learn how to spot repeating patterns that may point to a change in the market sentiment.
There are numerous candlestick patterns for trading, depending on a trader’s goals and preferences. Here are a few examples that may get you started.
Hammer
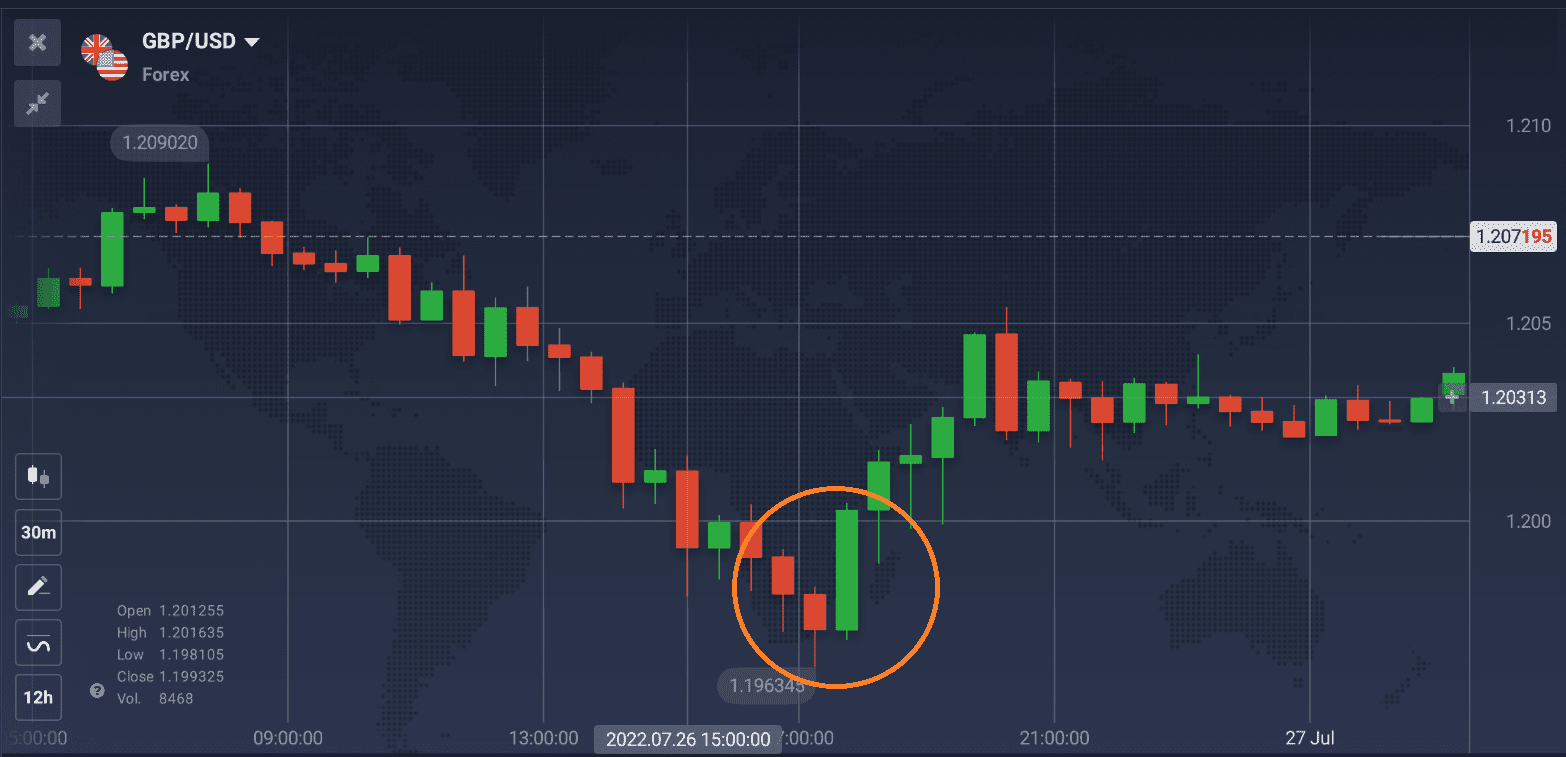
This is a bullish candlestick pattern that may point to an upcoming trend reversal. It might appear at the final stage of a downtrend and indicate the lowest price before a bounce.
When the lower shadow of a candle at the end of a downtrend is at least twice as long as the body, a hammer pattern may be observed. This shows that the price has recently decreased and then bounced back to the initial level. To confirm the reading, the following candle should close above the low or (even better – above the body) of the previous candle.
Catching this pattern might help traders pick an optimal moment to enter a deal. However, this approach is not 100% accurate, so traders should carefully consider potential risks before making a move. To get further confirmation of trend reversal when trading with candle patterns, they may apply technical indicators, like MACD or RSI.
Engulfing Pattern
Some candlestick patterns may point to both bullish and bearish trends depending on particular conditions. The engulfing pattern is a good example of such a tool.
Bearish Engulfing Pattern
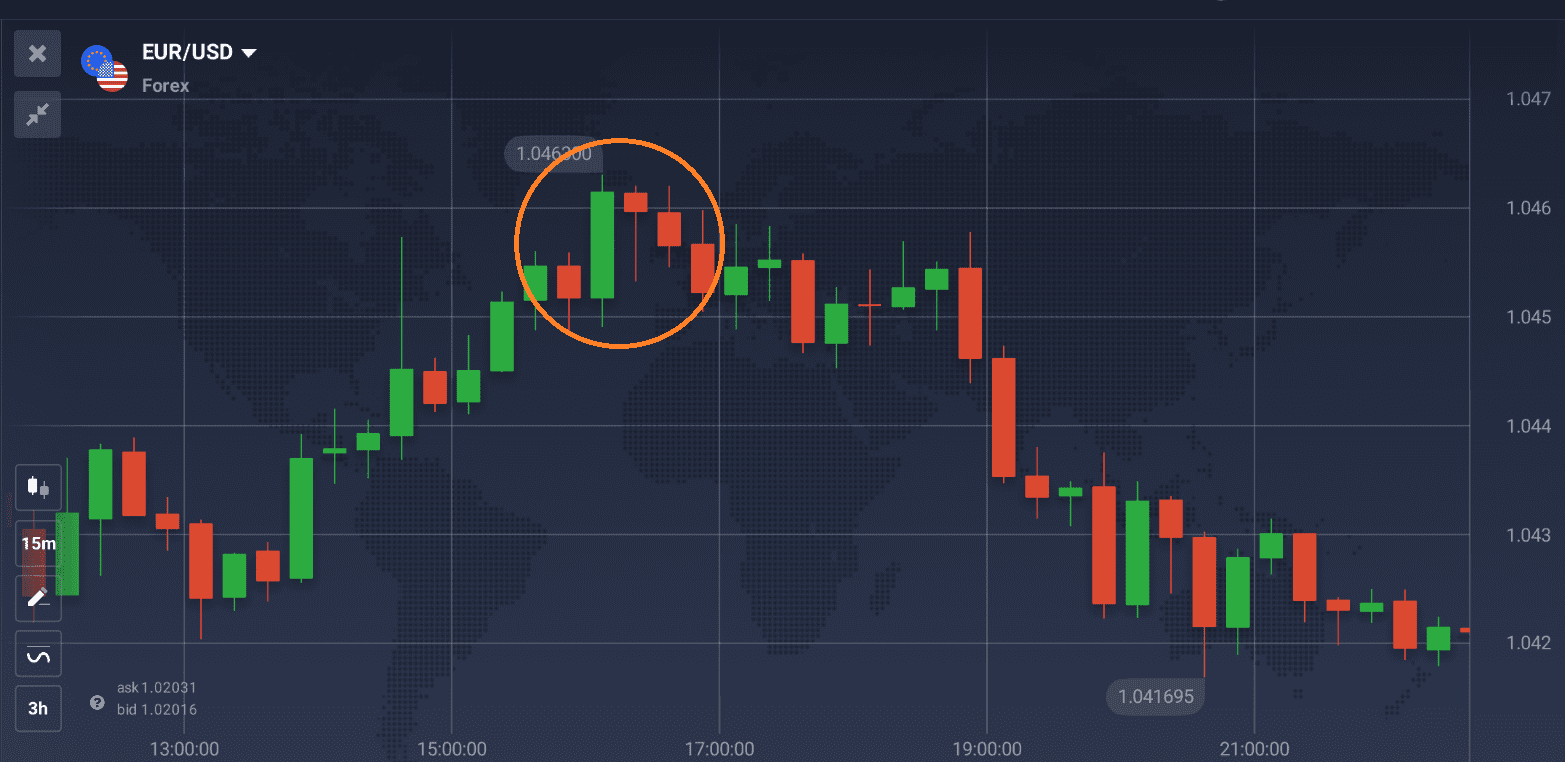
This candlestick pattern may occur at the end of an uptrend and indicate the following price decline. It involves a long red candle that engulfs a smaller green candle that came before it.
Traders might want to estimate how much longer the red candle is compared to the green one. If it consumes the entire body of the previous candle, this may be enough to indicate a subtle change in the sentiment. However, if it exceeds not only the body of the green candle, but also its upper and lower shadows, it might be a sign of an upcoming strong reversal.
Bullish Engulfing Pattern
Similarly to the bearish pattern, this one is formed by a larger candle engulfing the previous smaller one. In this case, the first red candle appears at the end of a downward trend. The second one is green, and it should cover the full body of the previous candle.
Bullish engulfing candlestick pattern may indicate an upcoming trend reversal, which might present potential trading opportunities. However, as with any technical analysis tool, there is no guarantee that it will occur. So traders should keep this in mind and make informed decisions when trading with candlestick patterns.
Harami
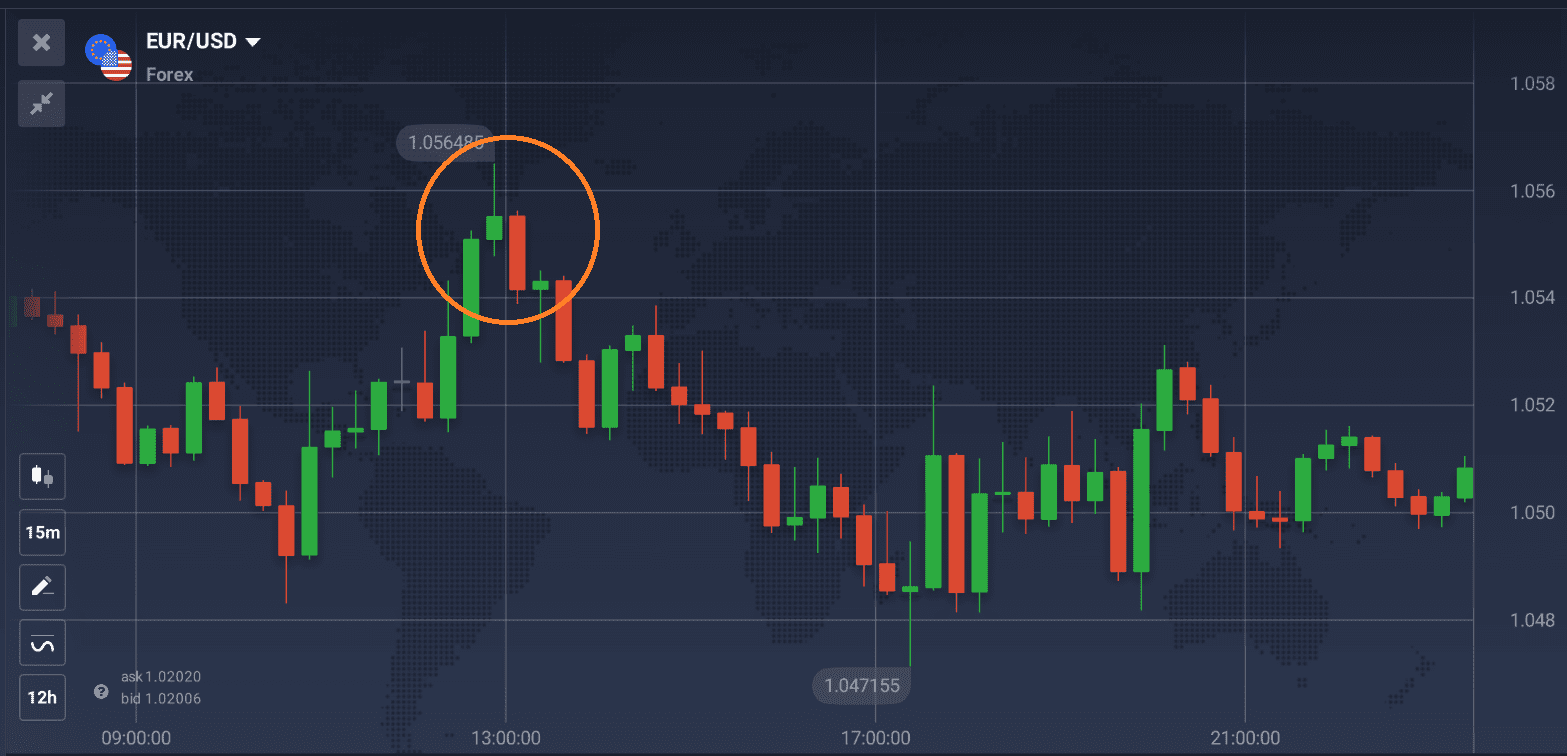
Bearish Harami
This pattern is formed by a small red candle following a larger green one. It may indicate an upcoming change in the sentiment. If the price continues to go up after this pattern is observed, the uptrend may last. On the other hand, if the Harami pattern is followed by a down candle, the price might continue declining.
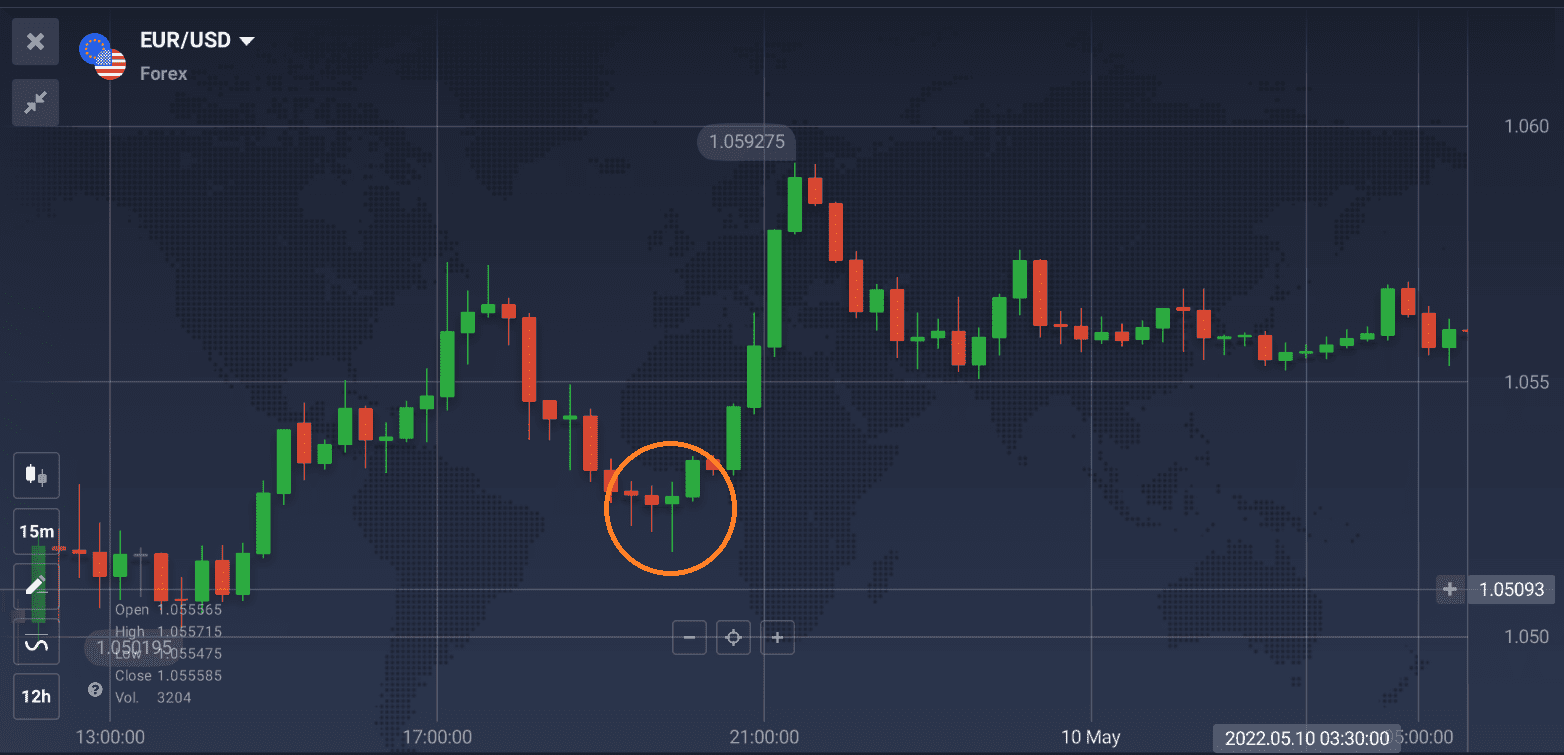
Bullish Harami
Traders may observe this pattern at the final stages of a downtrend, when a large red candle is followed by a smaller green one. Same as the bearish Harami, it may indicate two possibilities: the continuation of a downtrend or a potential reversal. To confirm the reading, traders should pay attention to the candle following this pattern. Whether it continues to go up or down, it may point to a lasting trend or a possible reversal.
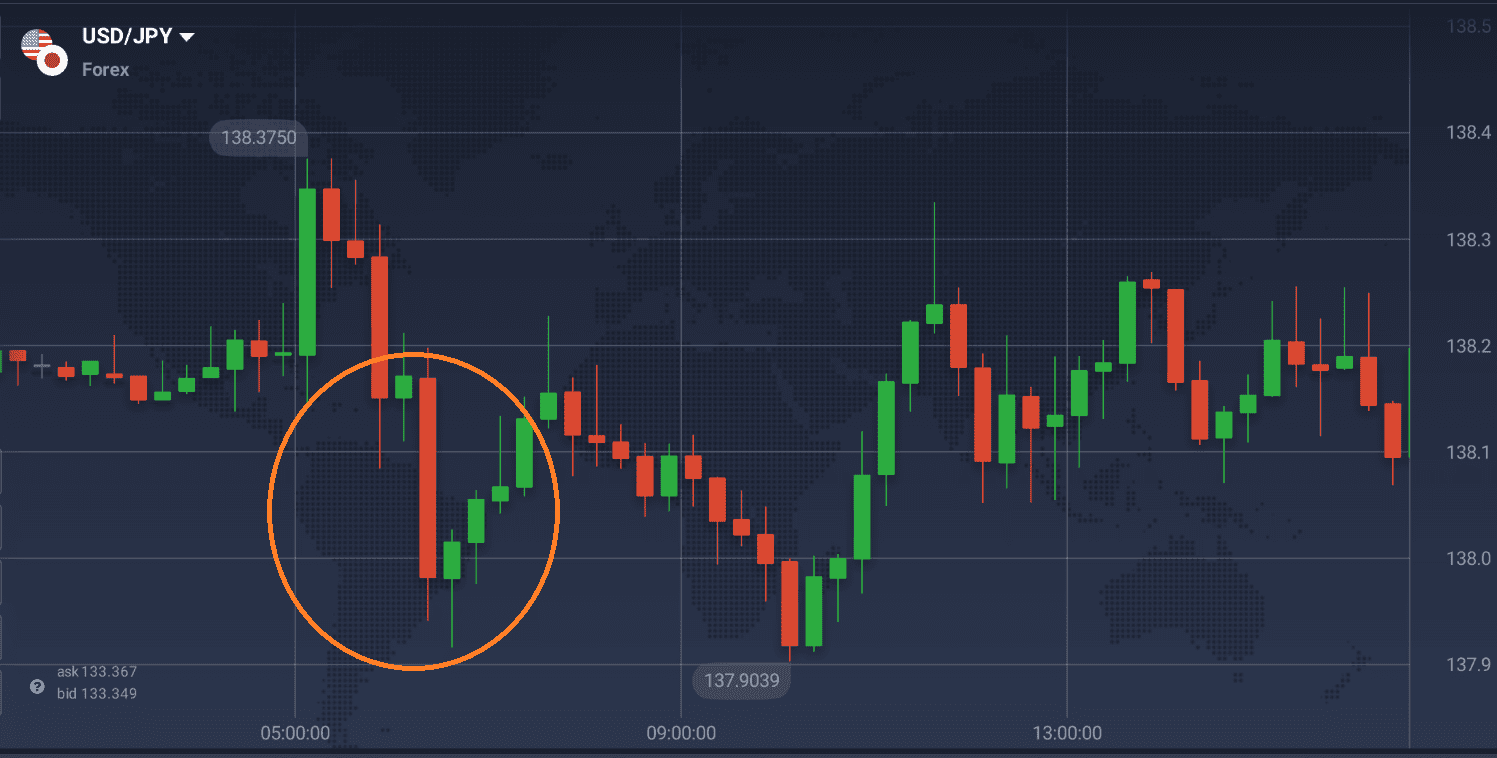
One important point to remember when using Harami candlestick patterns for trading is that they are quite subtle. Some traders might overlook them, assuming that the recent trend will continue shortly and not expecting any major shifts. So if a reversal bounce occurs, it may take them by surprise. You may want to keep in mind when looking for the optimal time to make a trade.
Three White Soldiers
This candlestick pattern consists of three long green candles following a downtrend. They appear one after another, each one ideally opening withing the body of the previous candle.
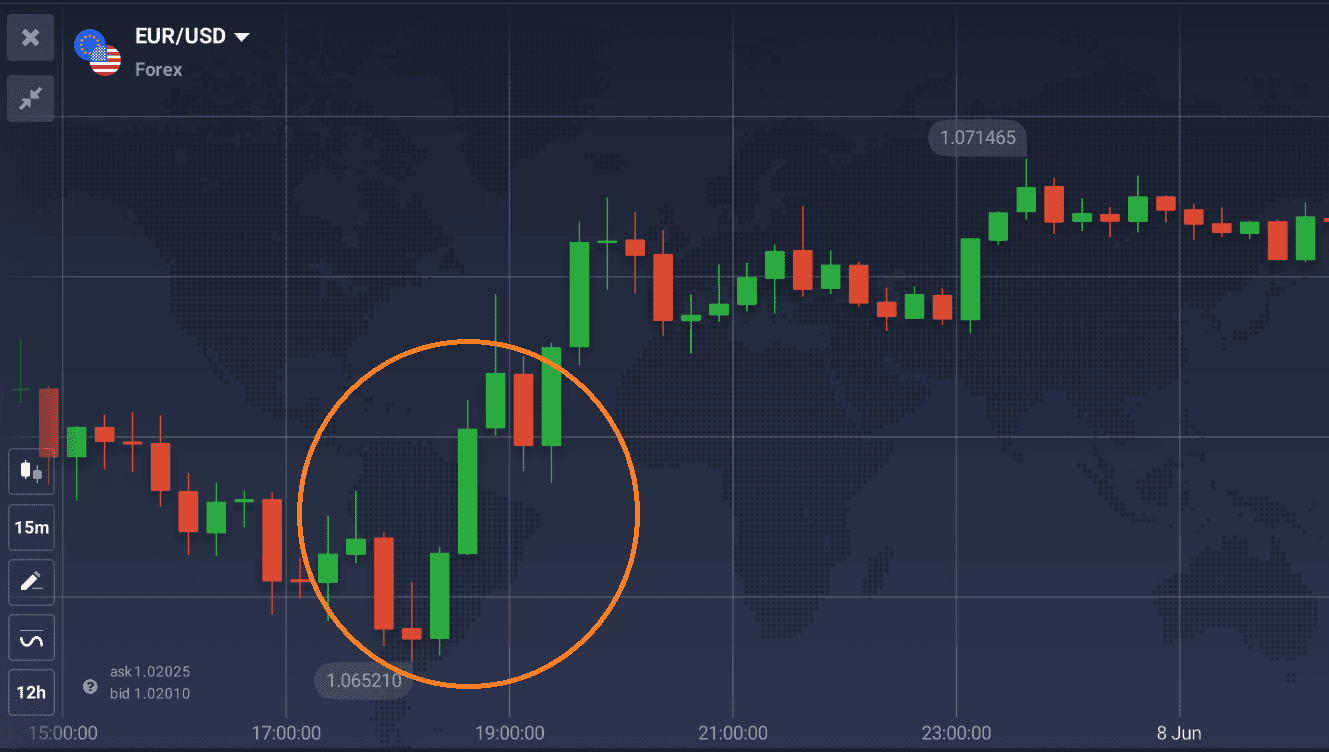
If this pattern is observed, it may offer an opportunity to open a bullish position. To get more accuracy, traders might use the three white soldiers pattern together with technical tools, such as trend lines and indicators.
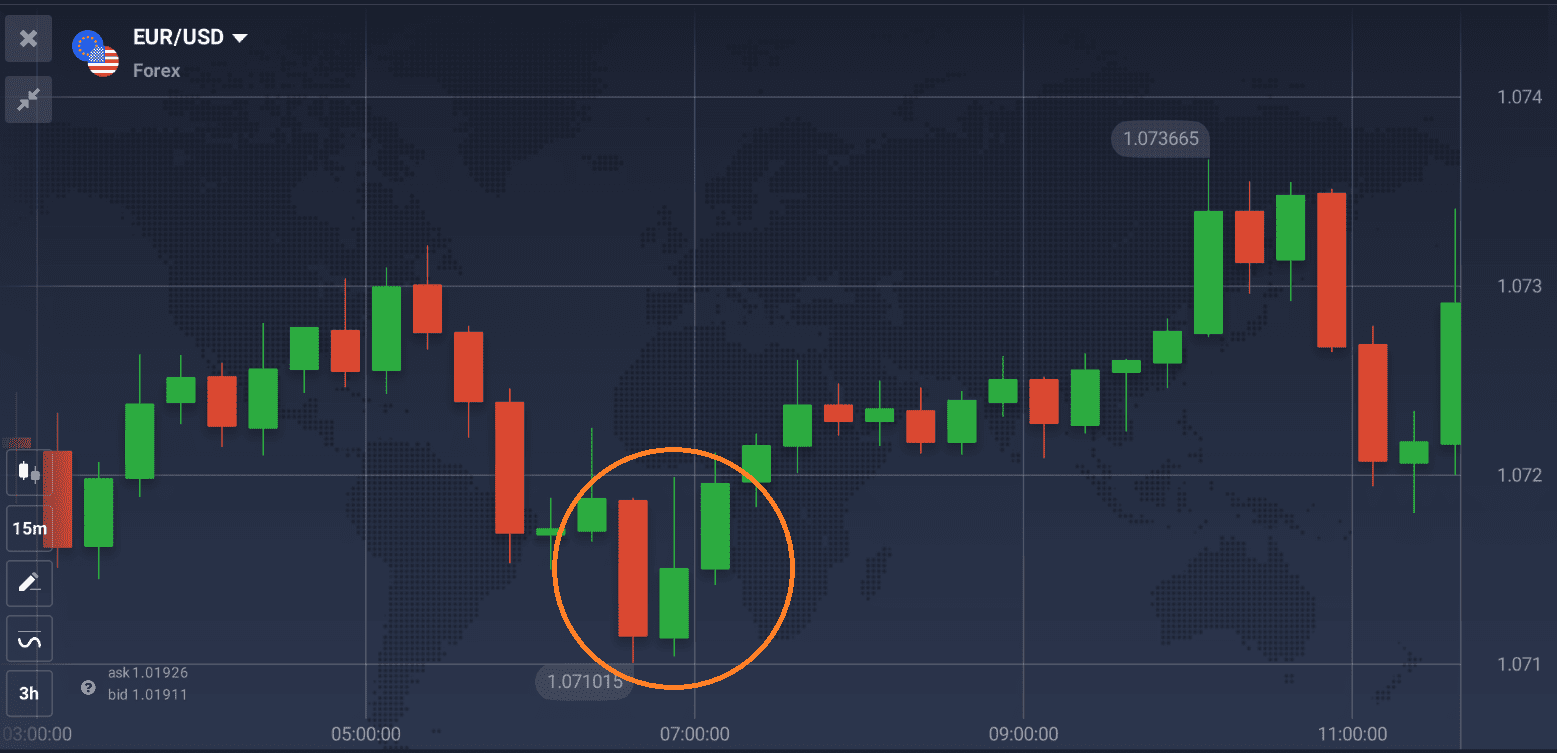
Three Inside Up
This is a bullish reversal pattern that consists of a combination of three consecutive candles. The first one is a large red one, the second is a smaller green candle opening and closing within the body of the first one. And the third candle is also green, closing above the previous candle.
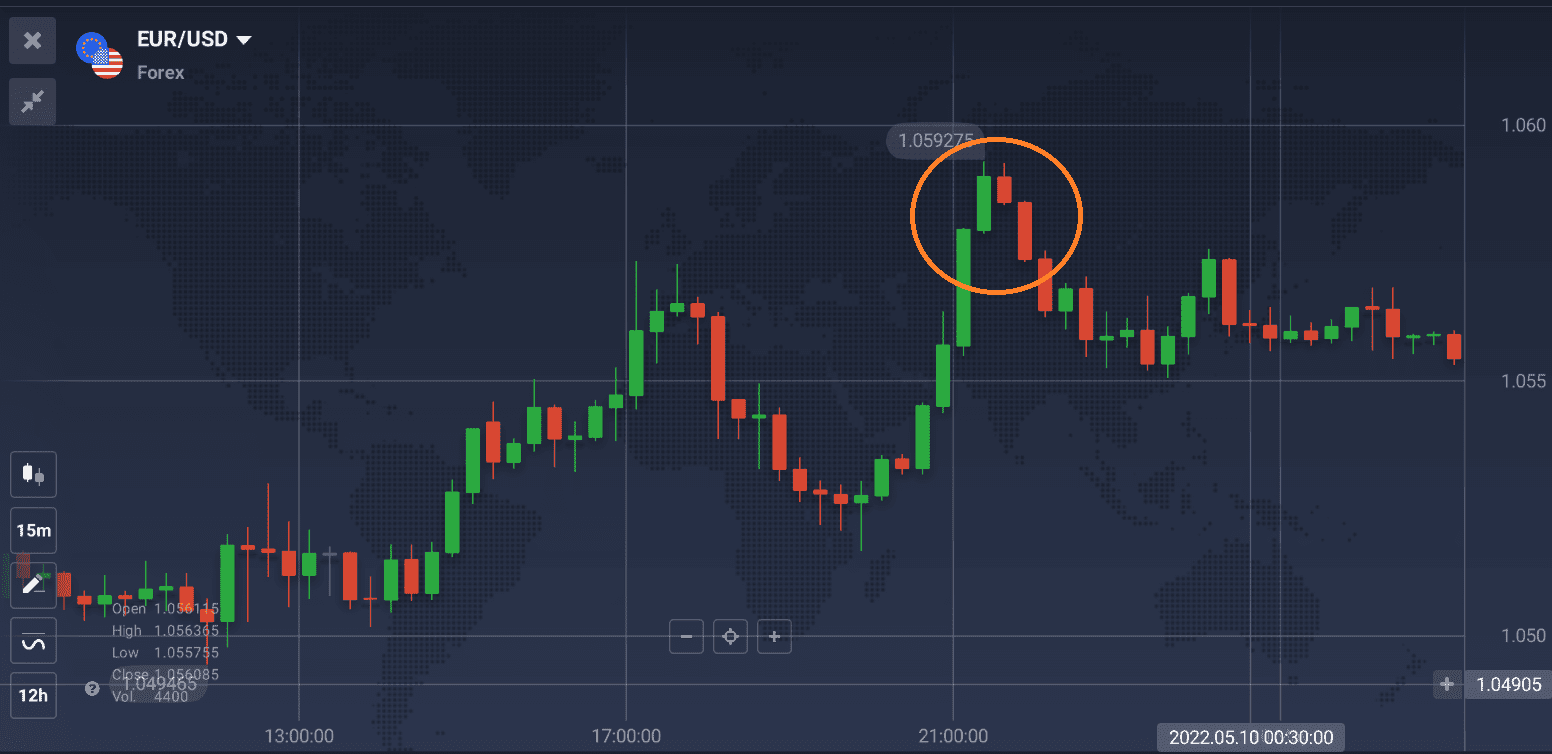
Three Inside Down
This pattern is somewhat similar to the previous one, consisting of three consecutive candles. However, in this case, a large green candle is followed by a smaller red one contained within the body of the first candle. The pattern is completed by a longer red candle that closes below the second one.
Keep in mind that these two candlestick patterns might be considered short-term and do no not guarantee major trend shifts. Yet, they may be useful when looking for price movements that might potentially lead to significant trend reversals.
Does Candlestick Trading Work?
The idea at the base of this technical analysis method is that price movements are not random. Consequently, traders may spot specific patterns. You may choose to trade candlestick patterns for a variety of assets, including stocks and forex.
There are certain indicators that traders should pay attention to. For instance, if they observe a long green candle, it may be a sign of a bullish trend. In case of a long red candle, a bearish trend may be emerging. However, it is always a good idea to use other analysis tools to support these findings, as candle patterns on their own may be misleading. Traders might use technical indicators to check their readings and make an informed decision.
It is also important to remember that candlestick patterns are formed by past and current price fluctuations. Which means, they cannot precisely indicate future price changes.
Key Takeaways
Combinations of candles form candlestick patterns that traders may monitor to confirm their predictions regarding price movements. Different candle patterns might point to potential bullish or bearish trend reversals, which may offer trading opportunities. However, it is better to use candlestick patterns for trading together with other technical tools to get more accurate readings.
