After learning about the basic trading indicators and testing them in practice, some traders may consider applying several tools at once to get more precision. But there are a few important rules to keep in mind when picking the technical analysis instruments you may consider as suitable to your trading approach. In this article, we will consider the answer to the question “How to combine trading indicators?” and cover 3 popular trading indicator combinations that might provide indications for identifying potential trading opportunities.
The golden rule of combining indicators
When it comes to trading indicator combinations, there is one ground rule: try not to overdo it. Having multiple indicators applied on the chart does not automatically improve your results. On the contrary, they might provide different indications and confuse novice traders. To avoid this, it may be helpful to understand which trading indicator combinations could suit specific market conditions and trading approaches.
Main types of trading indicators
Before going into the best indicator combinations, it is important to understand the difference between these tools. All indicators can be divided into several categories.
1. Trend indicators
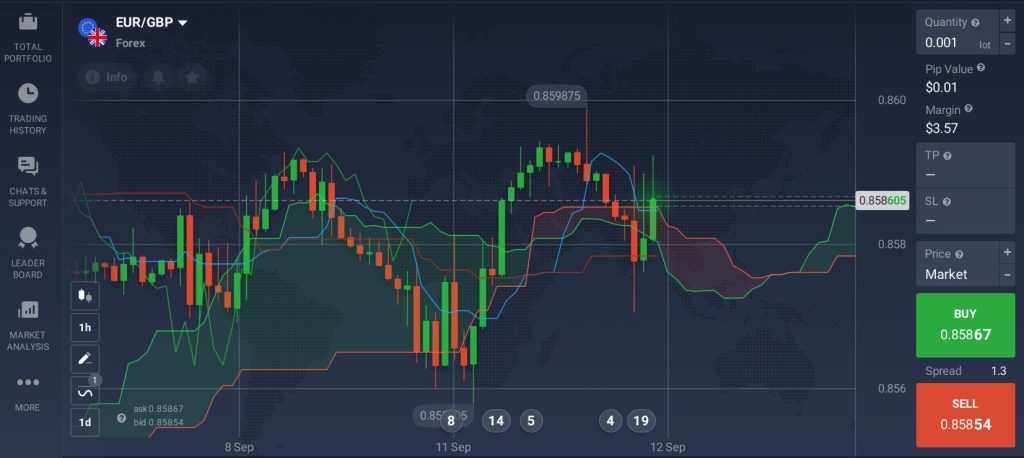
Trend-following indicators smooth out the price and follow the trend line of the chart. They are based on the past performance of the asset and may show the market trend and its strength. These indicators are often placed on or around the chart line. They include the KDJ indicator, the Ichimoku Cloud, Zig Zag and others.
2. Momentum indicators (oscillators)
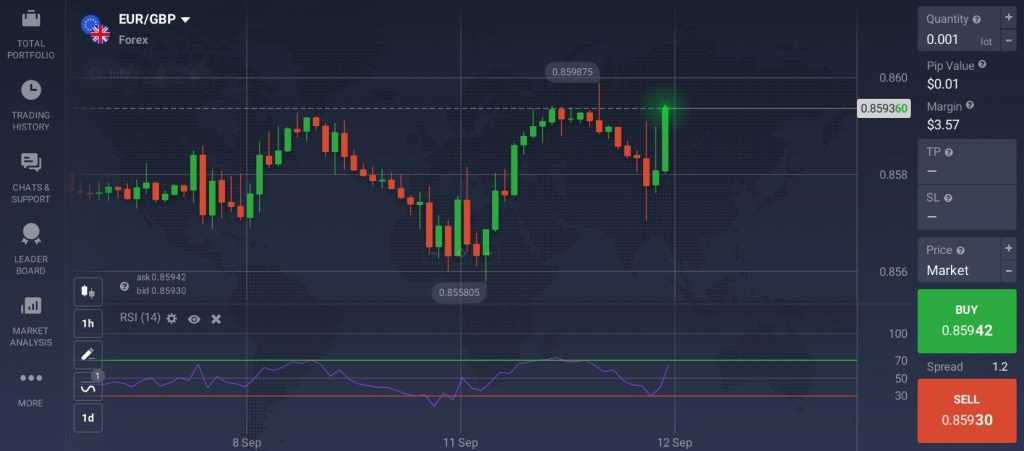
These indicators aim at determining the overbought and oversold levels and finding potential price reversal points. They are usually displayed under the chart, so it is easy to distinguish them from the other tools. For example, MACD and Schaff Trend Cycle, Awesome Oscillator, RSI, etc.
3. Volume Indicators
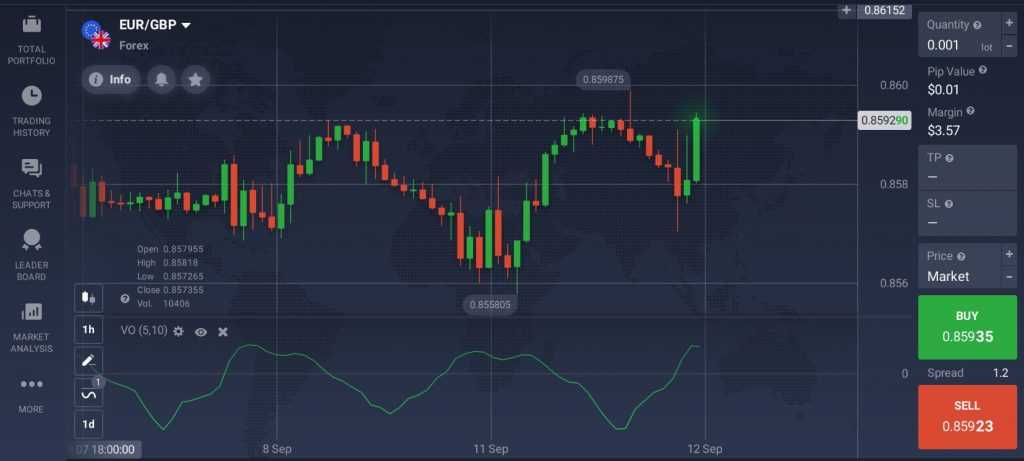
This class of indicators shows the volume of the traded asset. Tracking the volume is useful in order to see how strong the price movement might be. There aren’t as many volume indicators because they mainly focus on one function. However, by using them in trading indicator combinations, you might increase the accuracy of indications.
4. Volatility Indicators
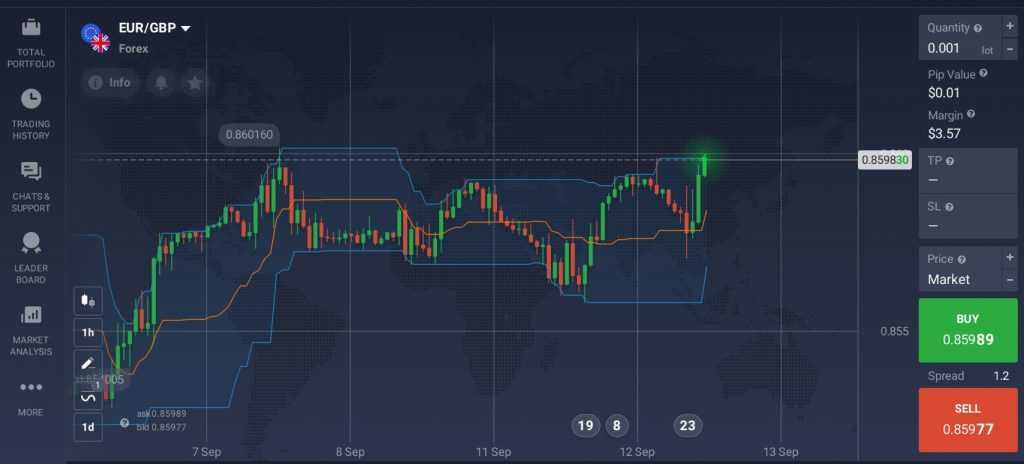
These indicators show how much the price of the asset is changing in a set period. The price has to be volatile in order for a trader to be able to trade it, but high volatility is associated with higher risk. Examples of popular volatility indicators include Donchian Channels and ATR.
How to combine trading indicators?
When combining indicators, it may be preferable to use indicators from different groups, rather than several indicators of the same type. Let’s check some examples of 3 trading indicator combinations that may be applied in different approaches.
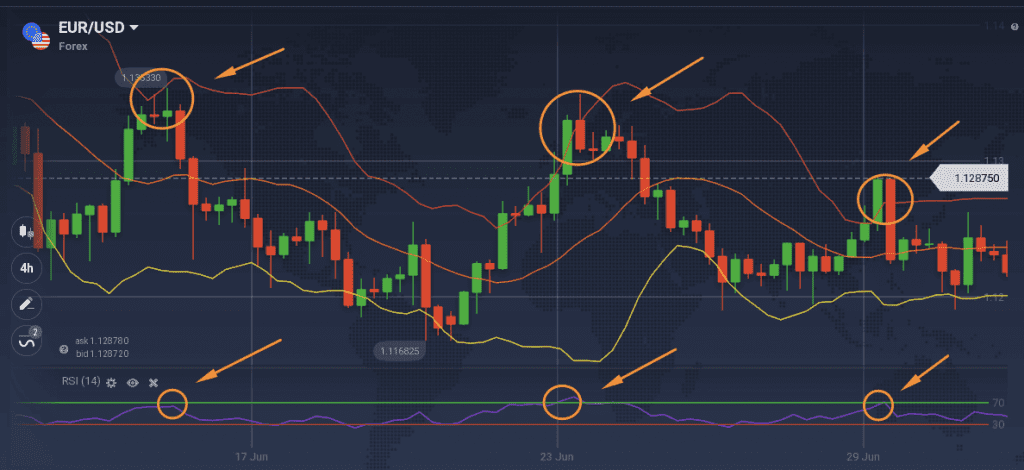
1. RSI + Bollinger Bands
- The RSI is an oscillator with the standard levels of 70 and 30 displayed on the chart. It is a line that fluctuates between the values of 0 and 100. When the line gets close to 70, the asset may be considered overbought. When it approaches 30, it might be considered oversold.
- Bollinger Bands (BB) consists of three lines: one exponential moving average (EMA) and two price channels above and below it. It shows the periods of high and low volatility of the asset. The more wide apart the Bands are, the higher the volatility and the stronger the movement is.
☝️
2. SMA + Stochastic
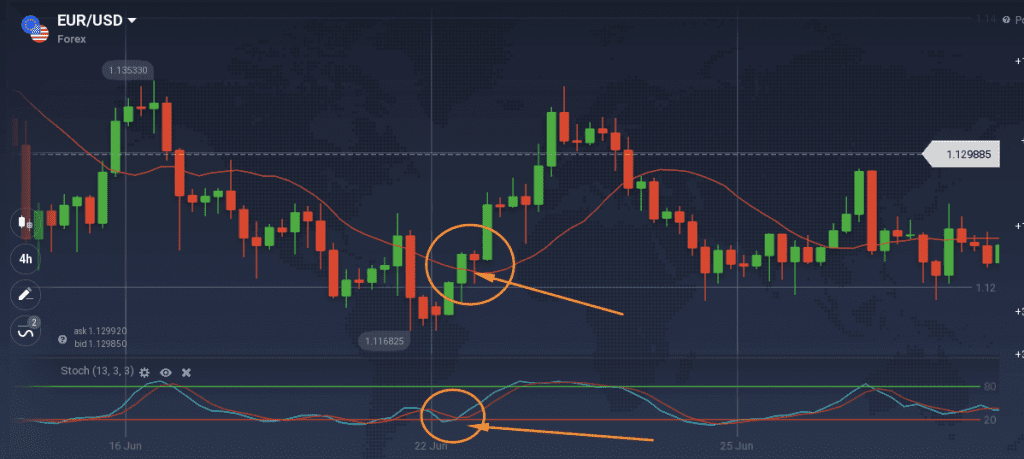
One more example of popular trading indicator combinations is Simple Moving Average (SMA) and Stochastic Oscillator.
- The Simple Moving Average (SMA) is considered a basic technical analysis tool. By smoothing the price fluctuations and reducing small insignificant swings it may help identify the real market trend.
- The Stochastic Oscillator displays possible overbought and oversold levels. It is a leading indicator, and it may provide indications of possible price reversals. It works well when combined with a lagging indicator like SMA, which is calculated based on the information of the past performance of the asset.
☝️
3. ATR + Parabolic SAR
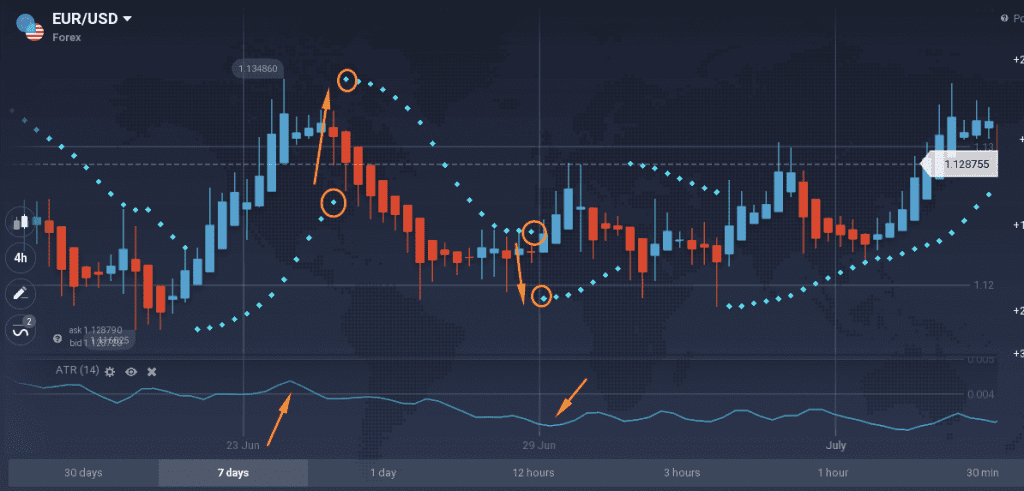
- ATR is a volatility indicator, it does not display the direction of the trend, but it measures how volatile the market is. And when the market is unstable, it might show potential trading opportunities. At the same time, ATR may be helpful in deciding on the appropriate Stop-Loss levels. In moments of high volatility, there is a higher risk, which might be managed with a Stop-Loss.
- By using trading indicator combinations of ATR with Parabolic SAR – a trend indicator – traders may look for entry points during a trending market. It might also assist in setting potentially more accurate Take-Profit and Stop-Loss levels.
☝️
In Conclusion
Trading indicator combinations may be a strong technical analysis tool. By applying several indicators from different categories together, traders may get valuable insights into market trends, volatility, trading volume and more to make more informed decisions. With that said, it is important to understand that there is no indicator or combination of indicators that will show 100% accurate indications. Any indicator may show false signals occasionally, which is why traders may consider applying appropriate risk management tools.
