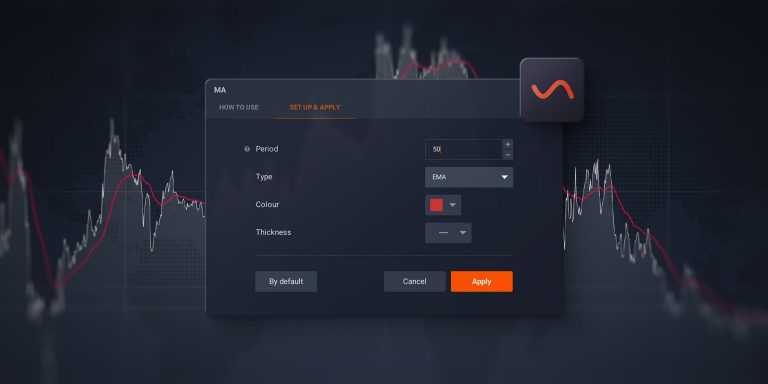
One of the most commonly used indicators, the Moving Average, has many variations and setting options. It is a lagging indicator, which means that it relies on the past performance of the chart, utilizing data from previous days and weeks to predict the future of the trend. The 50-period exponential moving average (EMA) is a popular tool that is widely used by traders for Forex and Stocks trading. This setting of the moving average marks an important threshold: a sort of neutral ground for traders to watch the trading field.
There are several ways to use the 50 EMA, as it is a versatile indicator, capable of providing multiple signals. By learning how to set it up, traders may enrich their trading approach with a new technical analysis tool.
How to set it up?
To set up the 50-period moving average, first, open the trade room and find “Moving Average” in the list of popular indicators.
Change the period of the indicator to 50 and choose “EMA” in the indicator type. EMA is the exponential moving average — the type of moving average that prioritizes more recent price changes by assigning them with bigger weights in the calculation.
Choosing the 50 period means that the indicator will take the last 50 candlesticks into calculation. The timeframe of the candlesticks you choose dictates how the indicator analyses the chart. For example, changing the candlestick timeframe to “1 day” will turn the indicator to the 50-day moving average and it may be suitable for trading on longer chart timeframes. Utilizing the 50-period EMA on, let’s say, an hourly candlestick chart may work well for an intraday strategy.
Support/resistance bounce
One of the possible signals traders may be looking for with the 50-period EMA is the support and resistance bounce.
If the price remains above the 50-period EMA, then pulls back to the support line and bounces upwards, it may be considered a buying signal and a long entry may be possible. At the same time, if the price remains below the indicator line, then pulls back to it and bounces downwards, it may be a signal of a downwards trend and a short entry may be possible.
To illustrate this with an example, let’s take a look at this EUR/USD Forex chart.
The chart moves confidently above the indicator, which acts as the support level for the price. Then, the candlesticks start moving lower and touch the indicator, a reversal follows after the price bounces off the indicator upwards. A “buying” deal might be opened at the moment the first green candlestick closes, confirming the upward trend.
Breakout
Another technique to utilize with the 50-period EMA is the breakout. To trade the breakouts, traders may wait for the chart to cross the indicator line in the up or down direction.
When the chart is moving below the indicator and then crosses it from below above, the signal to “buy” is received once the first green candlestick closes above the indicator line. Similarly, when the chart is moving above the 50-period EMA and crosses it from above below, a signal to “sell” is received, once the first red candlestick closes below the EMA.
In the example below, the CHF/JPY chart enters a bullish trend after crossing the 50-period EMA from above.
Stop Loss and Take Profit
While in most cases the 50-period EMA gives strong indications, they won’t necessarily be accurate 100% of the time. No indicator has the capacity to predict the market’s behavior correctly every single time. This is why risk management tools are necessary even in strategies involving this indicator.
Traders may set a stop loss at the peak level prior to the breakout. For instance, traders who are opening a bullish trade, may place the stop loss at the previous bottom; traders, opening bearish trades, may place the stop level at the previous top.
The example above shows the possible position of the stop loss level for the breakout trade on CHF/JPY.
Setting Take Profit levels might also be considered, as it allows for better money and risks management and helps prevent emotional trading.
Conclusion
The 50-period EMA is a versatile indicator that can be applied on different time frames, depending on the trader’s goals. It can be used to define support and resistance levels and it may indicate the possible trend change. Incorporating this indicator into your strategy may be rewarding, but it is important to remember about the risk management rules and practice reading the signals on the practice account first.

