The Zig Zag indicator and Fibonacci retracements are popular technical analysis tools that may help identify the market trend and spot potential optimal entry points. When traders combine these instruments, they might enhance the accuracy of the analysis and make informed trading decisions. So let’s take a look at how to trade with Zig Zag indicator and Fibonacci retracements combo.
How to Trade with Zig Zag Indicator?
If you are already familiar with this tool and can confidently apply different Zig Zag indicator settings on your own, feel free to skip this part and move on to the next section. However, if you haven’t used the Zig Zag trading indicator before, here’s a brief overview of its main features.
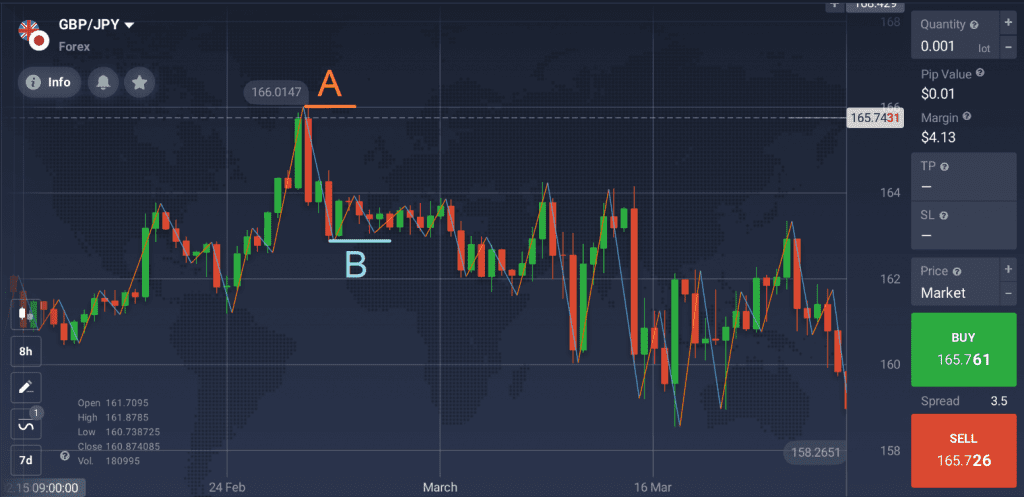
The Zig Zag indicator may be useful in identifying the overall market trend. It focuses on major price swings, filtering out short-term price fluctuations. This allows traders to see the bigger trend that may not be visible right away and choose the optimal moment to take action.
The indicator lines follow the price movements on the chart, moving between swing high (mark A) and swing low (mark B).

When the price change reaches a certain percentage, the Zig Zag indicator will draw a line to connect the previous high and the next low points. This creates a series of lines on the chart.
☝️
To learn more about this tool and its settings, please refer to the article Zig Zag: an Indicator to Eliminate Noise.
Trading with Fibonacci Retracements
Fibonacci retracements present as several horizontal lines often used to determine possible support and resistance levels and identify upcoming trend reversals.
Support and resistance levels may be considered as limits that the price might test while moving in the overall trend direction. When approaching one of the levels, the trend may be expected to either continue its movement or bounce back and reverse.
☝️
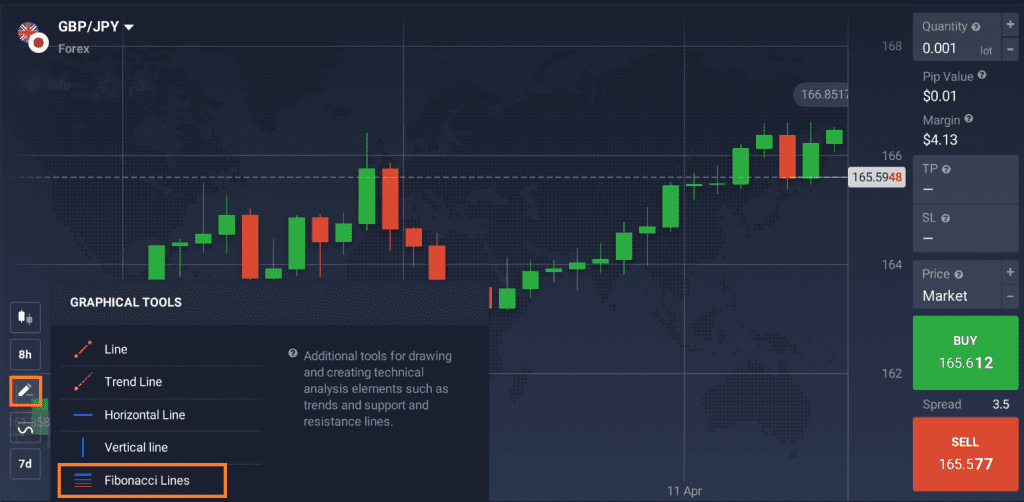
To use the Fibonacci retracements in trading, go to the ‘Graphical tools’ section of the IQ Option traderoom and choose the ‘Fibonacci Lines’ tool. You can select the color of the lines, as well as their width.

To start trading with Fibonacci retracements, find recent high and low points on the chart. For downtrends, click on the swing high and drag the cursor to the most recent swing low. For uptrends, do the opposite: click on the swing low and drag the cursor to the most recent swing high.
To learn more about this technical analysis tool, check out this article: How to Trade with Fibonacci Retracements.
How to Trade with Zig Zag Indicator and Fibonacci Retracements?
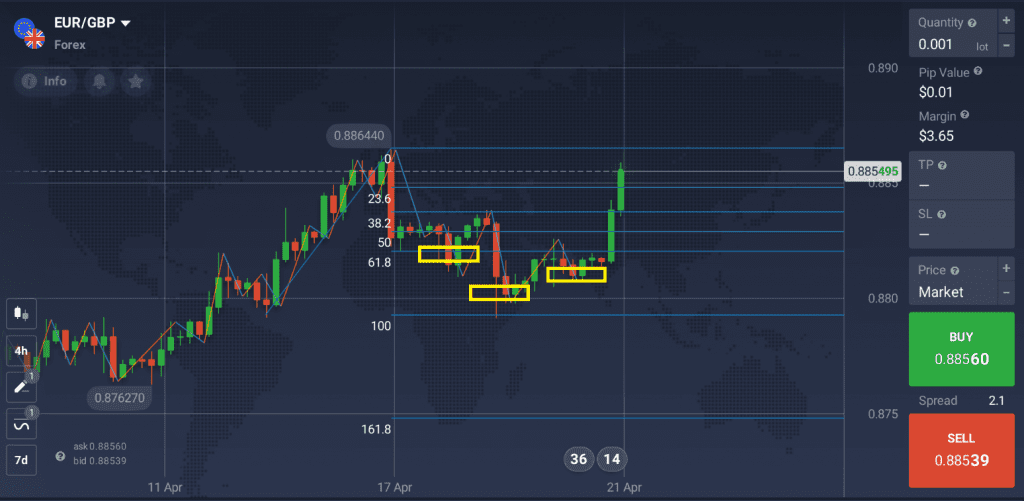
Even though both technical tools may be used separately, traders might choose to combine them to try to achieve more accurate results. By applying the Zig Zag trading indicator and Fibonacci retracements together, you may identify the optimal entry and exit points for your deals.
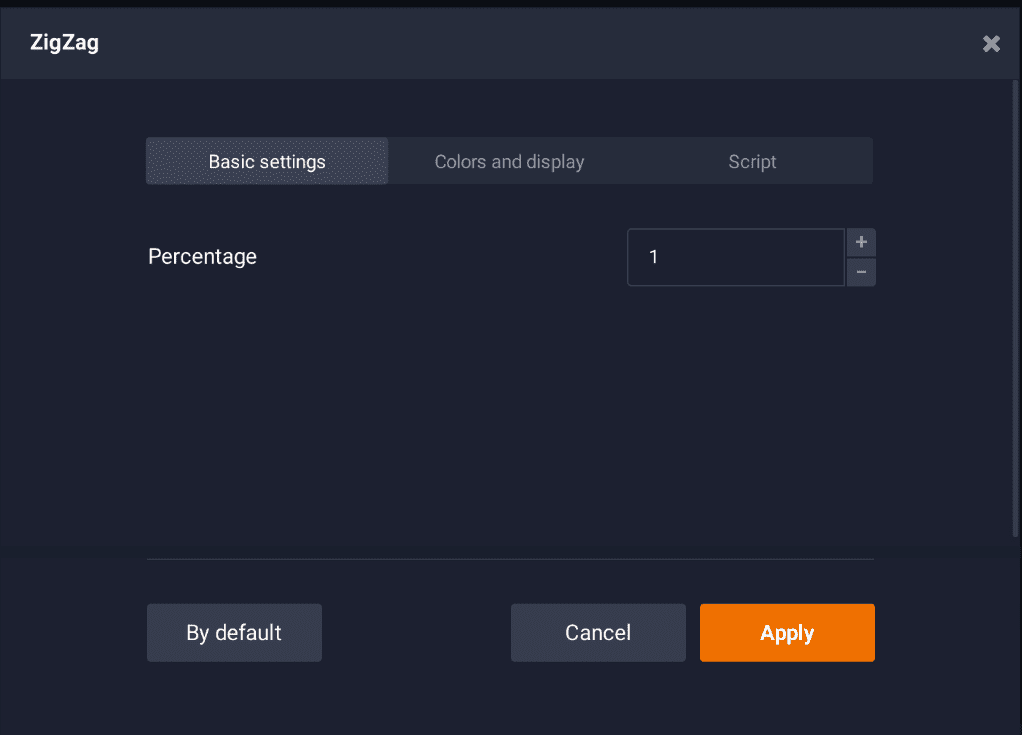
1. Determine the overall market trend using the Zig Zag indicator. You may choose different indicator settings depending on your goals. Keep in mind that the higher the percentage, the lower the accuracy.

2. Apply the Fibonacci lines tool as explained in the previous section to detect potential retracements.
3. Look for retracements, when the price moves in the opposite direction to the overall trend.
For instance, the overall trend identified by the Zig Zag indicator is bullish (upward). In this case, traders may wait for the price to bounce back to the previous level and take this opportunity to open a long (BUY) position.

Keep in mind that no indicator can guarantee 100% precise results. You may apply other technical tools, such as the RSI or candlestick patterns, to confirm your readings. Don’t forget about risk-management tools to protect your funds from unpredictable market conditions.
In Conclusion
The Zig Zag trading indicator and Fibonacci Retracements may be considered a powerful and effective combo for technical analysis. By applying these tools, traders may identify the main trend and spot retracements that might present trading opportunities. You may choose specific Zig Zag indicator settings to test different approaches and find the best trading setup for you.

