Traders use indicators and technical tools in order to find entry points and potentially catch the right time to execute a trade. There are many indicators available on the IQ Option platform to choose from. One of the most popular tools is the KDJ indicator. Some choose to work with the standard KDJ settings, but others may choose to change the KDJ parameters in order to have a better customization that may open new possibilities. Keep reading to understand how to set up KDJ according to your personal approach.
How does the KDJ indicator work?
KDJ is similar to the Stochastic indicator. It has the K and the D lines that indicate the overbought and oversold conditions much like other oscillating indicators. The J line is what distinguishes KDJ: it is used to show the deviation of K from D and indicates the strength of the trend. The indicator oscillates between 0 and 100 values and indicates when the asset enters the overbought or oversold area.
In order to read the indicator’s signals, traders generally search for crossovers of the indicator’s lines. These are called the golden fork and the dead fork.
The golden fork
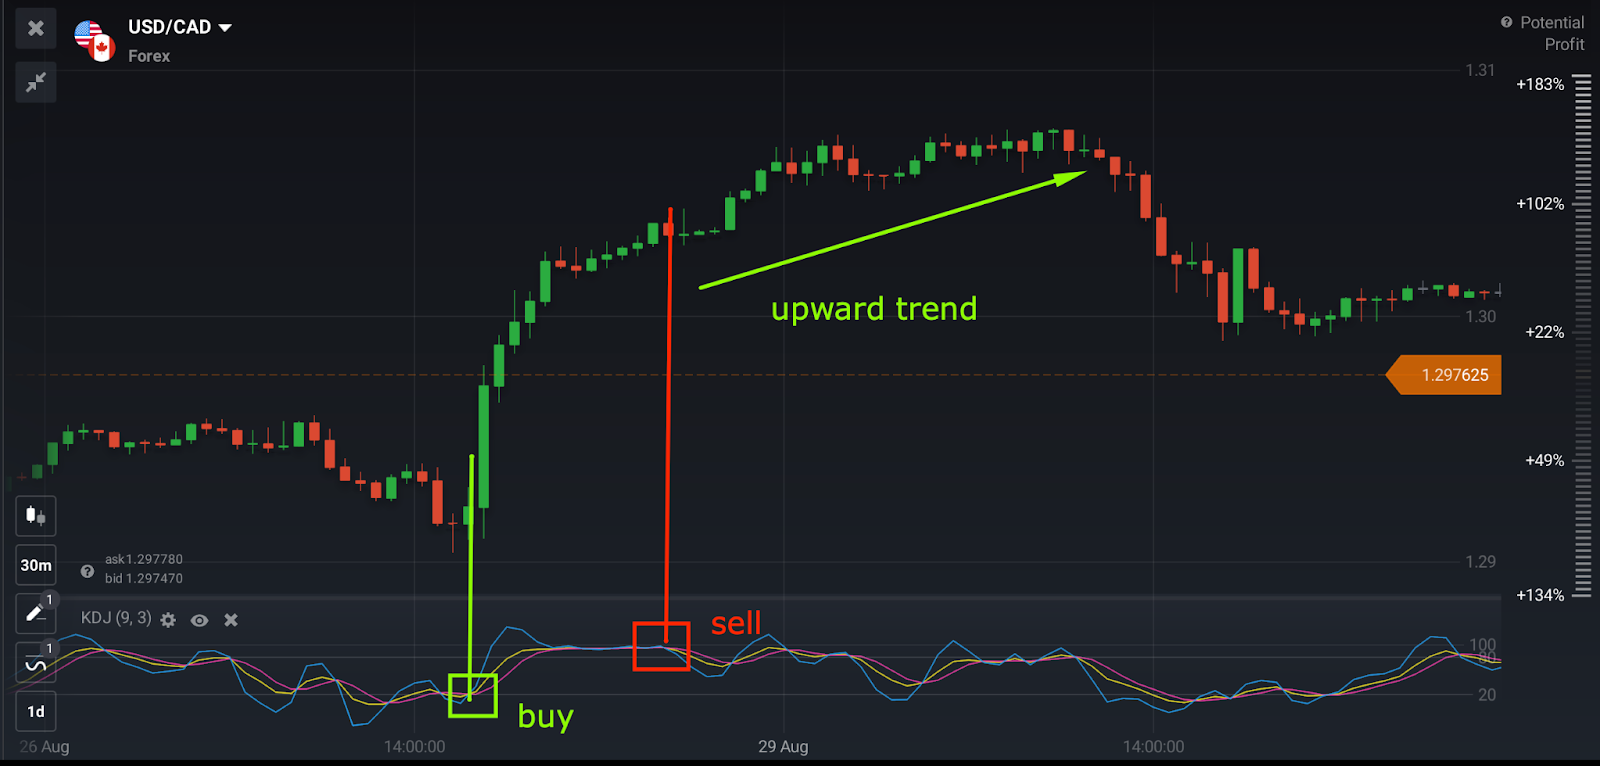
This crossover of KDJ lines indicates that the asset entered the oversold area and that the trend might soon reverse upwards. A Buy signal may be registered when:
- All three lines cross at the 20 level or below (oversold area);
- The indicator lines are moving upwards from the crossover;
- The chart is showing a bullish candlestick pattern.
The dead fork
This crossover might indicate that the asset is the overbought area and its price chart may soon reverse and start dropping. A selling signal may be received when:
- All three converge above the 80 level, in the overbought area;
- Lines K and J cross line D downwards;
- A bearish candlestick pattern is present.
KDJ settings adjustment
While the standard settings for KDJ are 9, 3, 3, these settings may not always work perfectly for different timeframes. The reason is that the period of 9 takes into account nine previous candlesticks. Some traders choose to increase the indicator’s period in order to smooth the price action.
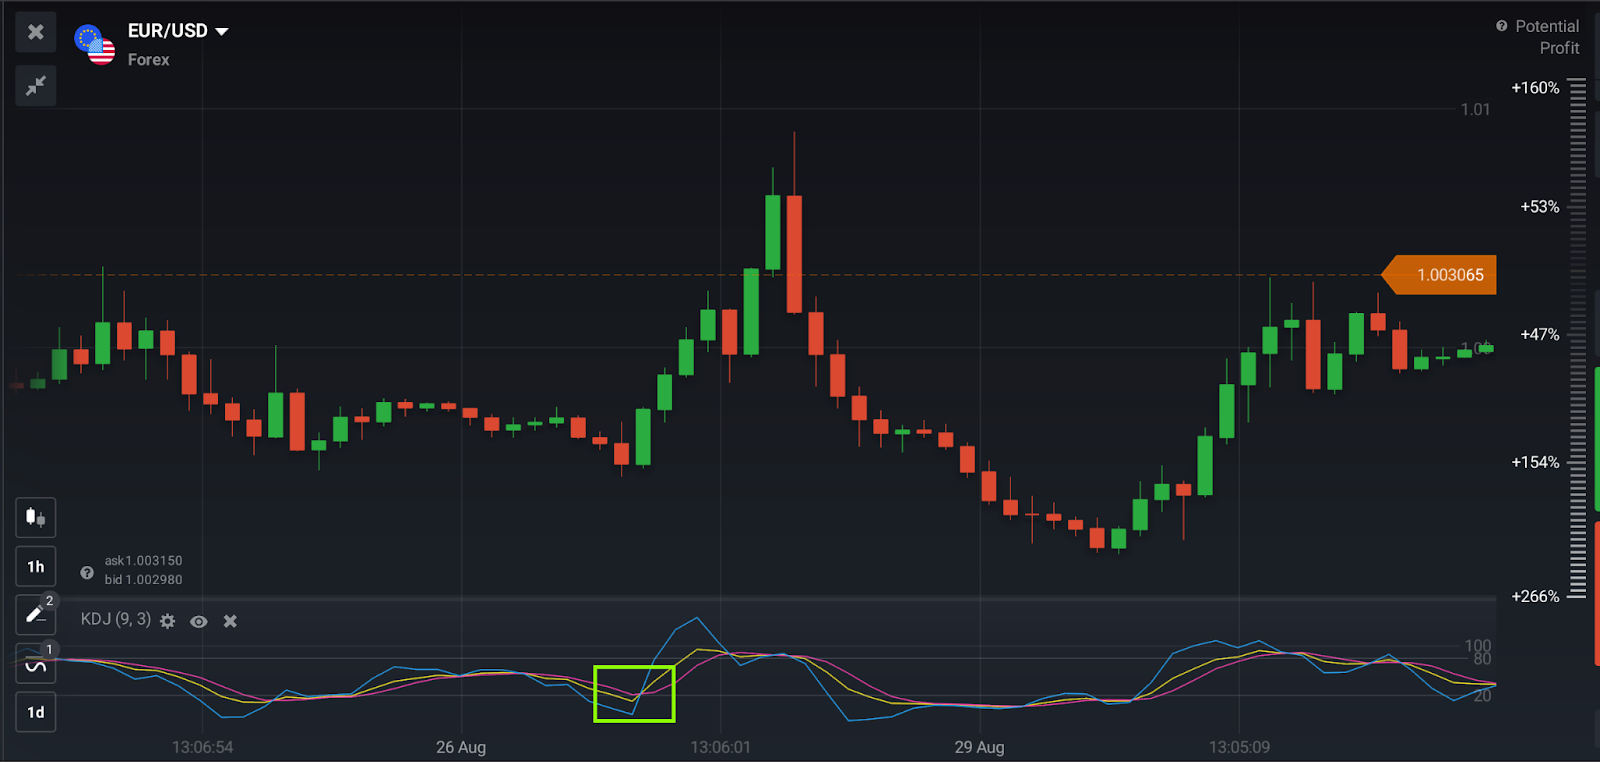
You may look at the example above. Here KDJ is applied with the standard settings of 9, 3, 3. According to the indicator, a selling signal is received when the price enters the overbought area, however, the upward trend still continues well after the selling signal is received. Following these indications, a trader could have missed out on potential better outcomes after closing the deal.
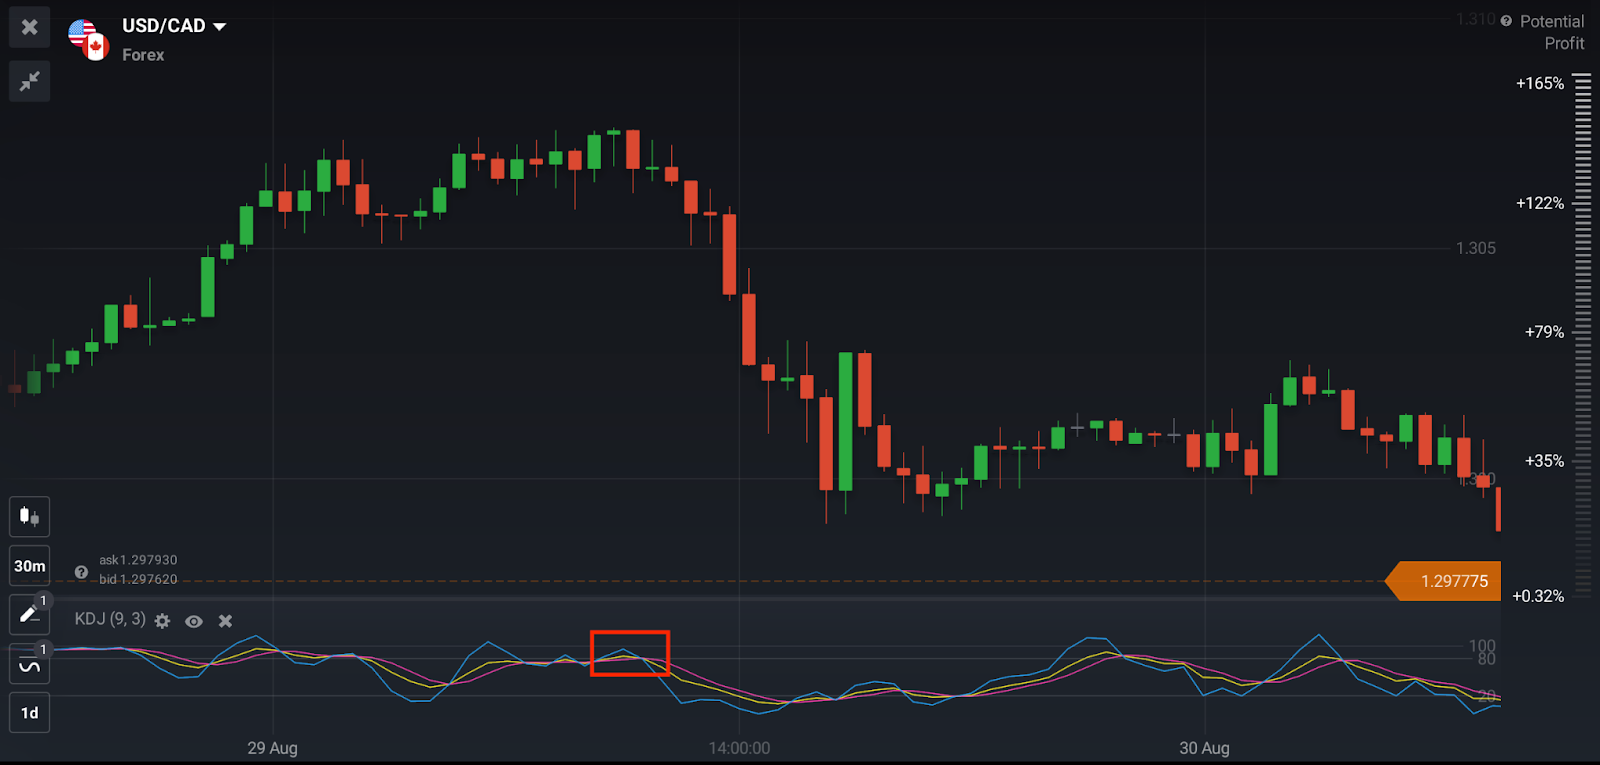
In order to adjust the indicator and make it more universal, traders may change the period of the indicator (the amount of candlesticks taken into calculation). To do this, you may click on the settings wheel near the indicator and adjust the settings of the K line.
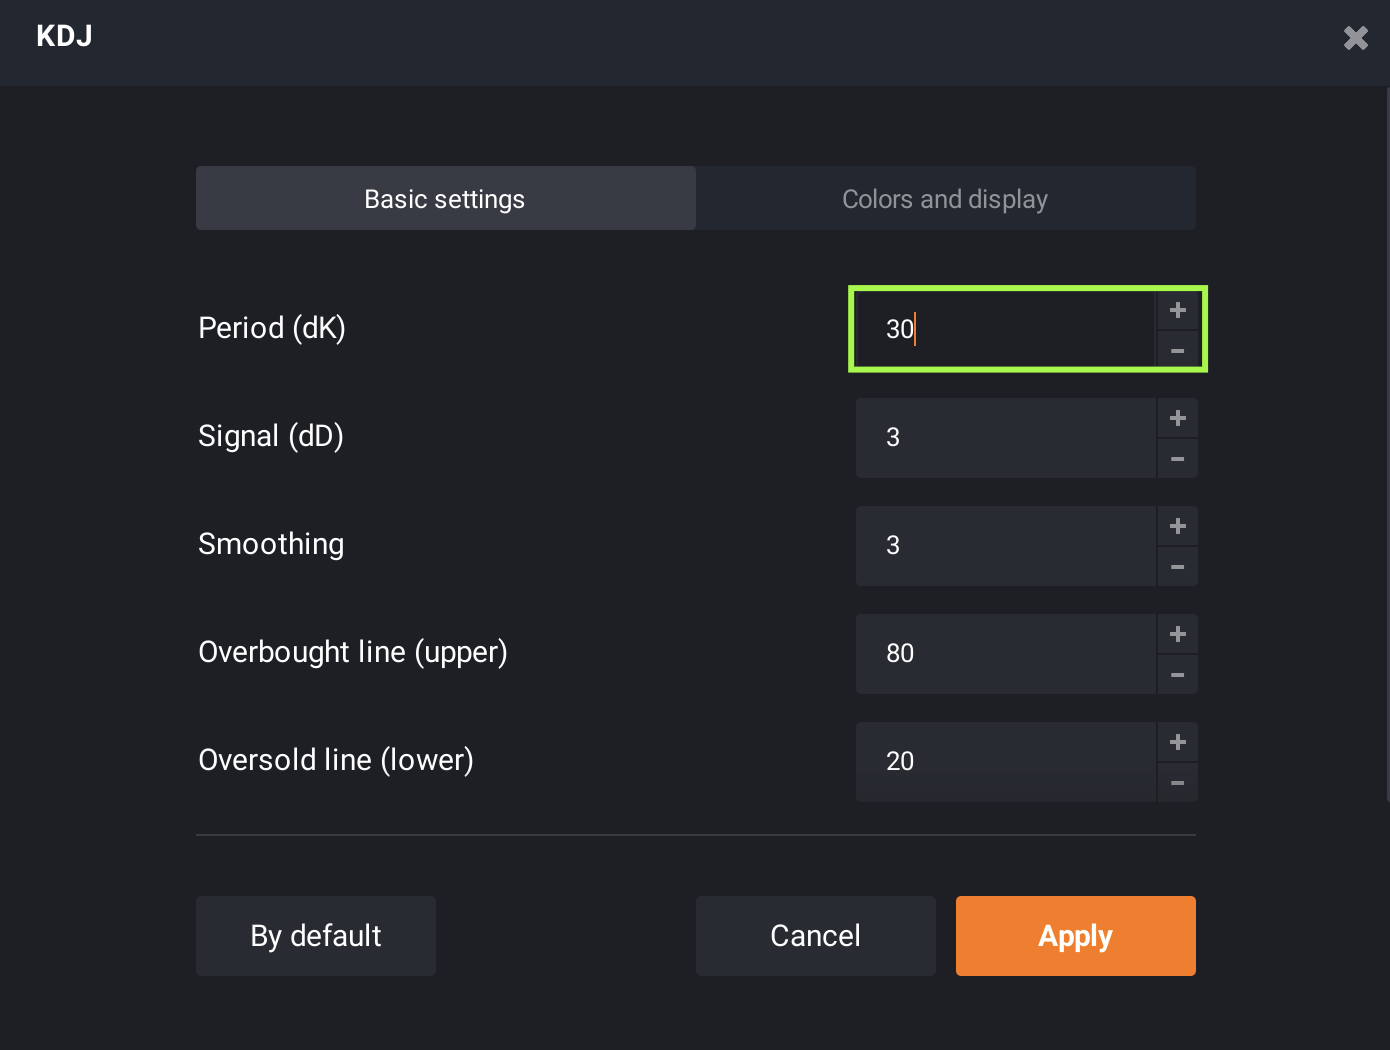
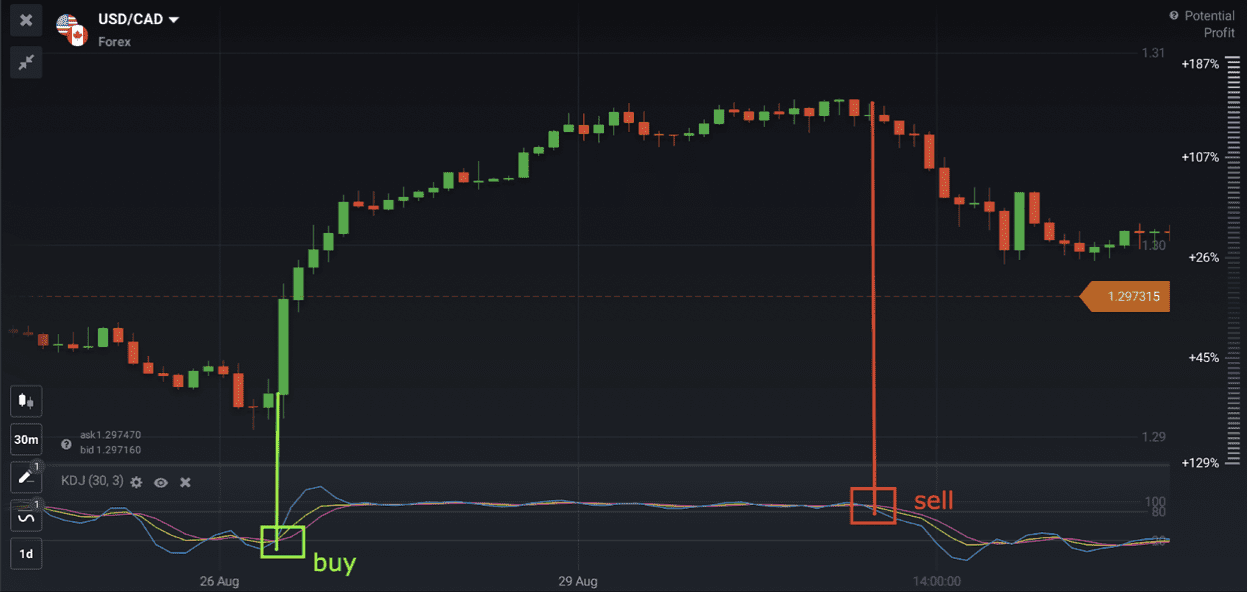
After adjusting the KDJ indicator with a period of 30, the same chart looks quite different. It is clearly visible that the indicator smooths the price action better, fluctuates less, and only reacts to more significant price changes.
How to know the correct KDJ indicator settings?
Adjusting the KDJ indicator to your particular trading style and asset is important in order to improve the accuracy of the indicator. Of course, it doesn’t mean that the indicator will never make mistakes: there is still always a possibility of divergence and incorrect signals. There is no method or indicator that can guarantee perfect results every time. Still, choosing the indicator settings correctly can improve one’s chances and help with the overall trading approach.
👉
In order to master the skill of customizing indicator settings, it is important to spend a lot of time doing it on the practice balance. This way, there is no pressure of making a mistake and no risk of losing real funds.
To sum up
KDJ indicator is a popular and useful tool that may help to determine possible trade entries and exits. However, as any indicator, it can show false signals and cause losses. In order to potentially improve the odds, traders can learn to adjust the indicator settings according to the timeframe they are trading. Choosing a smaller period for short timeframes and a larger period for long timeframes is the general rule of thumb.
