

If you always thought of a price chart as a sequence of ups and downs, a zigzag, essentially, you were not wrong. The ZigZag indicator aims at simplifying the chart and removing price noise to reveal the actual underlying trend. This instrument is not self-sufficient, but understanding how to use the ZigZag indicator in combination with other tools may enhance your approach.
How Does the ZigZag Indicator Work?
The ZigZag indicator is a fairly basic tool used by analysts to understand when a security is reversing its trend. By identifying support and resistance zones, it identifies large price swings while filtering out short-term fluctuations and eliminating the noise of daily market conditions.
To understand how to use the zigzag indicator in trading, it is necessary to decide on the settings for the percentage of the price movement. The default setting is 5%, however, depending on the approach, traders may set it to a lower percentage, like 4%, or higher values, like 9 or 10 percent. A value of 10% would mean that only price fluctuations of more than 10% will be taken into account. Smaller price changes are eliminated, allowing traders to see the bigger picture.
The indicator places the points where, according to the calculation, the reversal happens on the chart. These points are connected with lines that form a zigzag shape.
How to Use ZigZag Indicator in Trading?
The ZigZag indications only appear when the price movement between a swing high and a swing low is greater than the specified percentage. Since the indicator analyses historical data, it is not a predictive tool on its own. However, it may help a trader to possibly spot a significant change in price, filtering out minor movements.
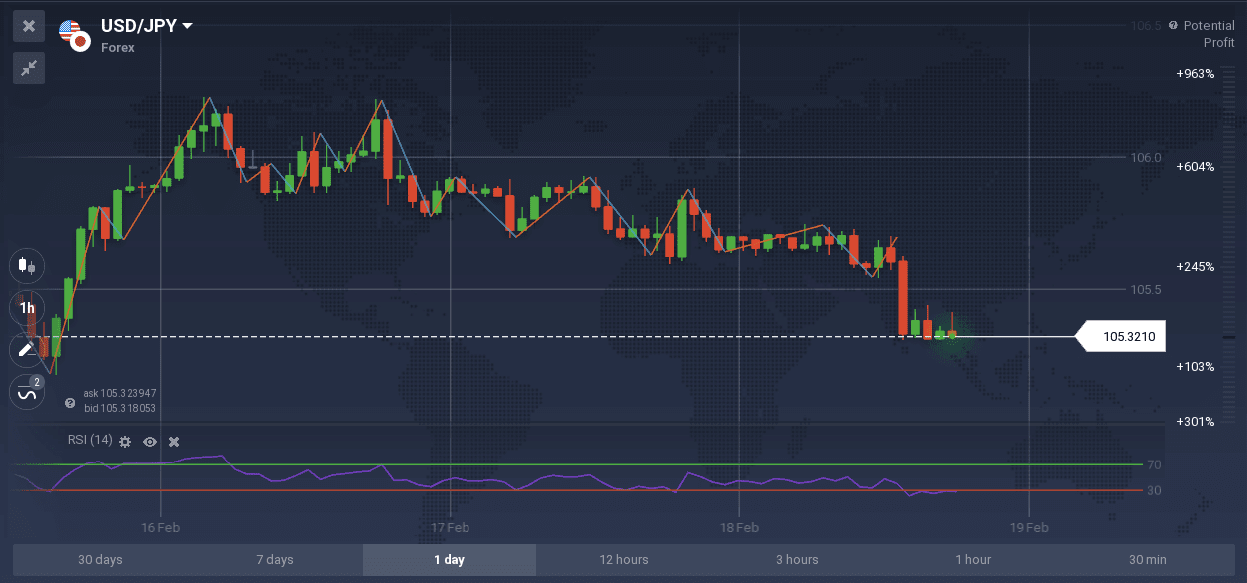
In the example above, ZigZag is applied on a FX pair USD/JPY with a 5% setting. As shown, it can be combined with oscillators, for instance, RSI, to form a tool for a trend reversal strategy.
The ZigZag indicator’s highs and lows can also be useful for spotting chart patterns like Head and Shoulders and building the Fibonacci retracement levels.
ZigZag Indicator Settings
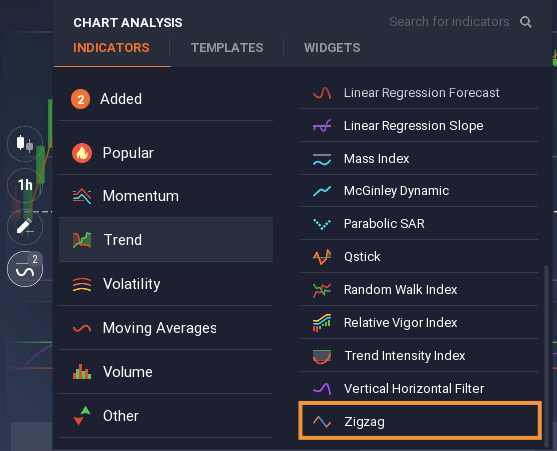
When trading with the ZigZag indicator, it’s important to decide on the price movement percentage you will be utilizing. Find the indicator in the “Trend” section of the indicators’ menu.
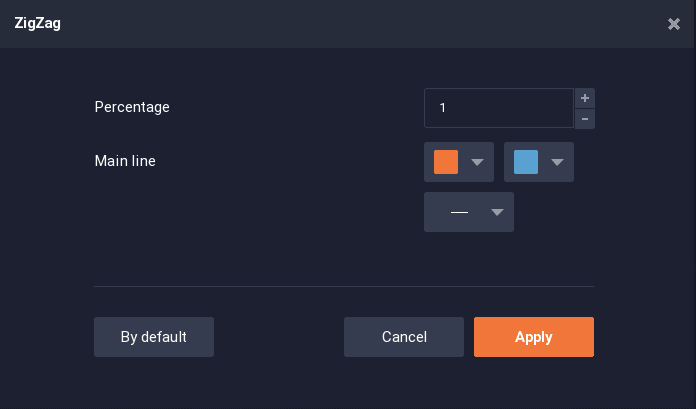
The default settings of the indicator suggest a 1% movement, however, this value can be changed according to your personal strategy. The thickness as well the color of the lines are also adjustable.
This video may help you visualize the price charts and learn more about ZigZag indicator settings.
Conclusion
The ZigZag indicator might be a convenient and simple tool to remove noise from the market and to visualize the actual progress of a financial instrument from point A to point B. However, you should always keep in mind that there is no guarantee for 100% accurate signals when trading with the ZigZag indicator.