
The Awesome Oscillator (AO) is a histogram-type indicator designed to measure market momentum. It was first introduced by Bill Williams. It is used to determine the momentum of the asset at hand in the course of recent events within the context of a wider time frame. The indicator is also used to confirm/disprove trends and determine possible reversal points.

How does it work?
The idea behind the Awesome Oscillator is simple. Basically, the indicator is a moving average crossover. A 34-period simple moving average is subtracted from a 5-period simple moving average. Both lines are built across the bars’ midpoints instead of closing or opening prices.

The AO values fluctuate above and below zero. The resulting values are plotted as green and red bars. Red color indicates that the bar is lower than the previous one. A green bar is in turn higher than the one before.
How to set up?
Setting up the Awesome Oscillator indicator in the IQ Option platform is easy.
Click on the ‘Indicators‘ button in the bottom left corner of the screen. Then go to the ‘Popular‘ tab and choose the Awesome Oscillator from the list of possible indicators.
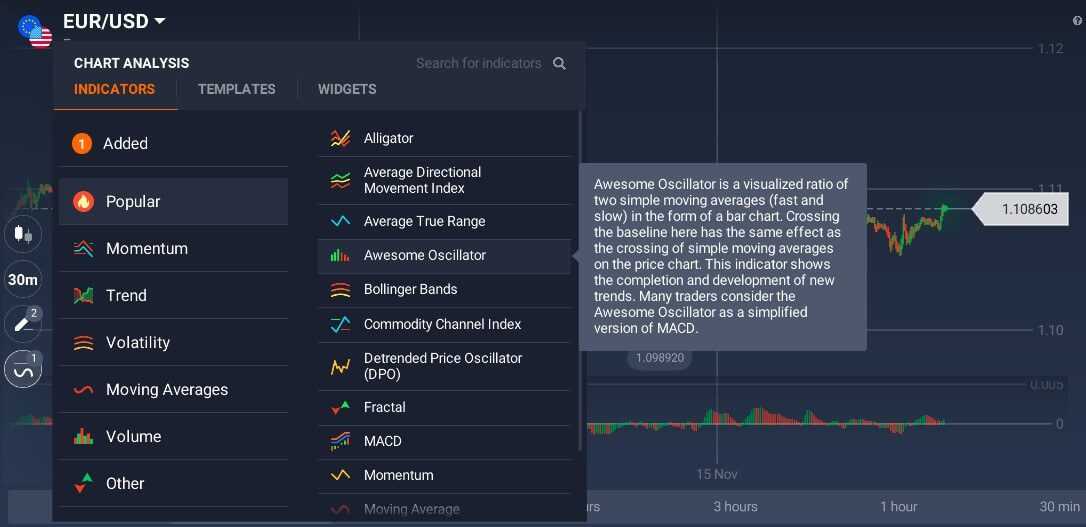
Click the ‘Apply’ button. The indicator will appear in the bottom part of the screen, right below the price chart.
The Awesome Oscillator is ready to use.
How to use Awesome Oscillator
Zero Line Crossover
This is the most basic and straightforward signal a trader can get when using the Awesome Oscillator. When the AO crosses above the zero line, short-term momentum is rising faster than long-term momentum. In this case, a zero line crossover might be considered a buying opportunity. When the AO crosses below the zero line, short-term momentum is falling faster than long-term momentum. This pattern is considered by some traders as a selling opportunity.

Twin Peaks
Two consecutive peaks can be used as a trading signal, as well. Twin Peaks take on the role of the bullish trend messengers when 1) both peaks are below the zero line, 2) the second peak is higher than the first one and is followed by the green bar, 3) the trough between the peaks stays below the zero line.

Twin Peaks become a signal of an upcoming bearish trend when 1) both of them are above the zero line, 2) the second peak is lower than the first one and is followed by the red bar, 3) the trough, in turn, remains above the zero line.

Saucer
Saucer is another signal that can be used for early trend forecasting. It follows the changes in three consecutive bars. When the Awesome oscillator is above zero and two consecutive red bars are followed by a green one, the saucer is considered to be bullish.

When the Awesome oscillator is below the zero line and two consecutive green bars are followed by a red one, the saucer is defined as bearish.

The Awesome Oscillator is a diverse and valuable technical analysis indicator that helps traders estimate the momentum and possible trend reversal points. However, it should be used with caution and double-checked with the help of other indicators and different time frames, as no indicator is capable of providing accurate signals 100% of the time.
