US consumer level inflation was weaker than expected and stopped the dollar’s advance versus major world currencies. The Consumer Price Index came in at 0.1% in June showing continued expansion of prices at the consumer level. The data is positive for the US economy but takes impetus from the FOMC to raise rates. The expectations were for CPI to advance 0.2% with a chance for coming in hot (PPI data released the day before was hotter than expected), so CPI was a definite miss.
The year over year comparison is still elevated at 2.9% but mitigated by a much cooler read on core inflation. At the core level, ex-food and energy, CPI increased by 0.2% and below expectations. Prices or food increased by 0.2% and gas by 0.5% but those gains were offset by a net decline in energy of -0.3%. The core YOY read is 2.4%, above the FOMC expectations but down from the previous month and evidence the established rate hike timeline is working.
What this means for the dollar is simple, a reprieve from rally. The data suggests the FOMC is on track to contain inflation and that means no upgrade to rate hike expectations. With rate hike expectations cooling off the dollar should weaken against the world’s major currencies. The risk now is that data from the EU, the UK and Japan will fail to show growth and leave global forex markets treading water in search of direction.
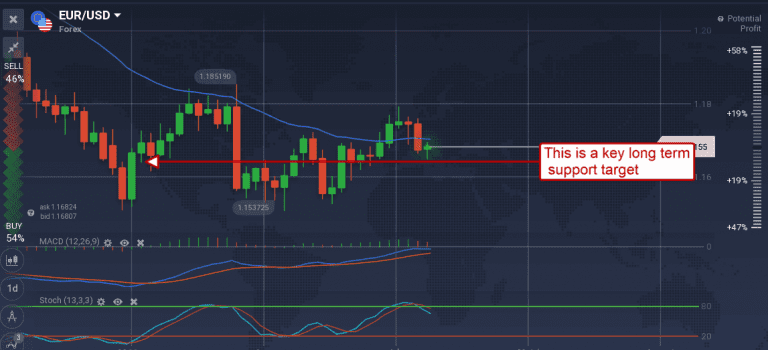
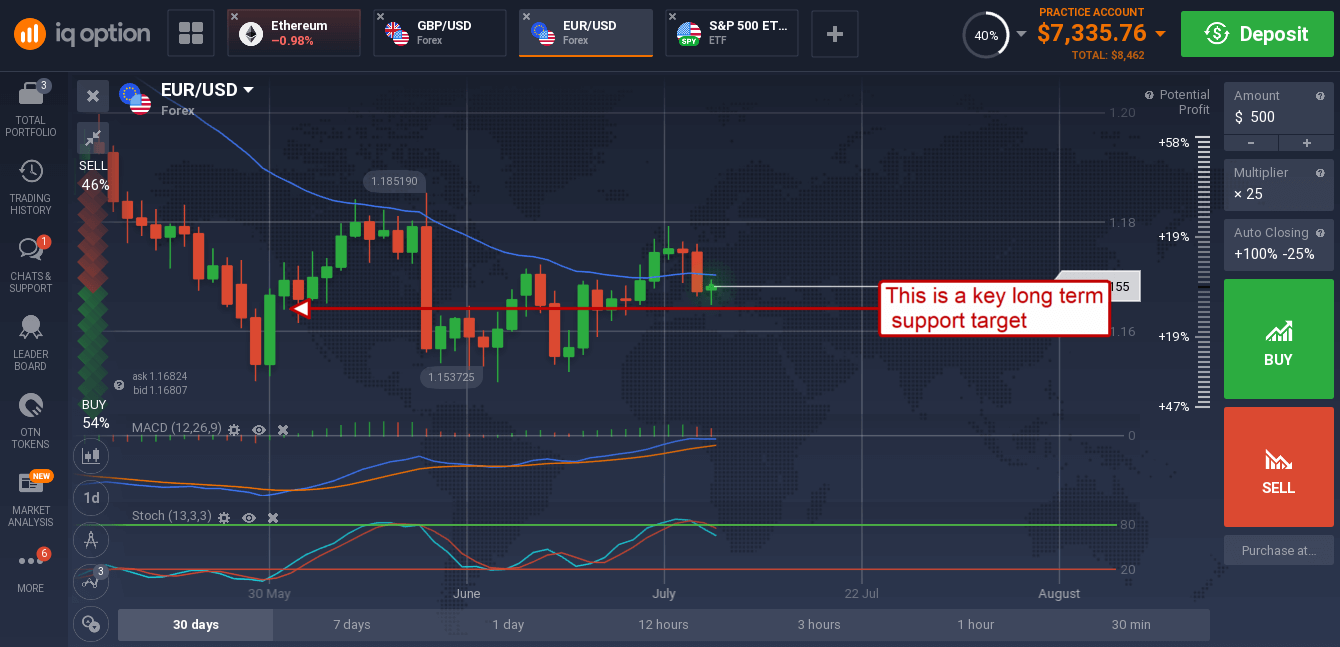
The EUR/USD moved down in early trading to test support at 1.670 and support held. The market was looking for a stronger read on CPI and did not get it. This move sets the pair up to rebound from support provided EU data remains firm. Thursday’s data shows CPI in member nations Germany and France have held up while industrial production within the greater EU continues to expand above expectations. If the pair persists in downward movement support targets are 1.16250 and 1.1550.
The GBP/USD also held its ground in Thursday action creating a small green candle by late morning. The pair is tracing out what will become a Head & Shoulders reversal if the pound continues to strengthen.
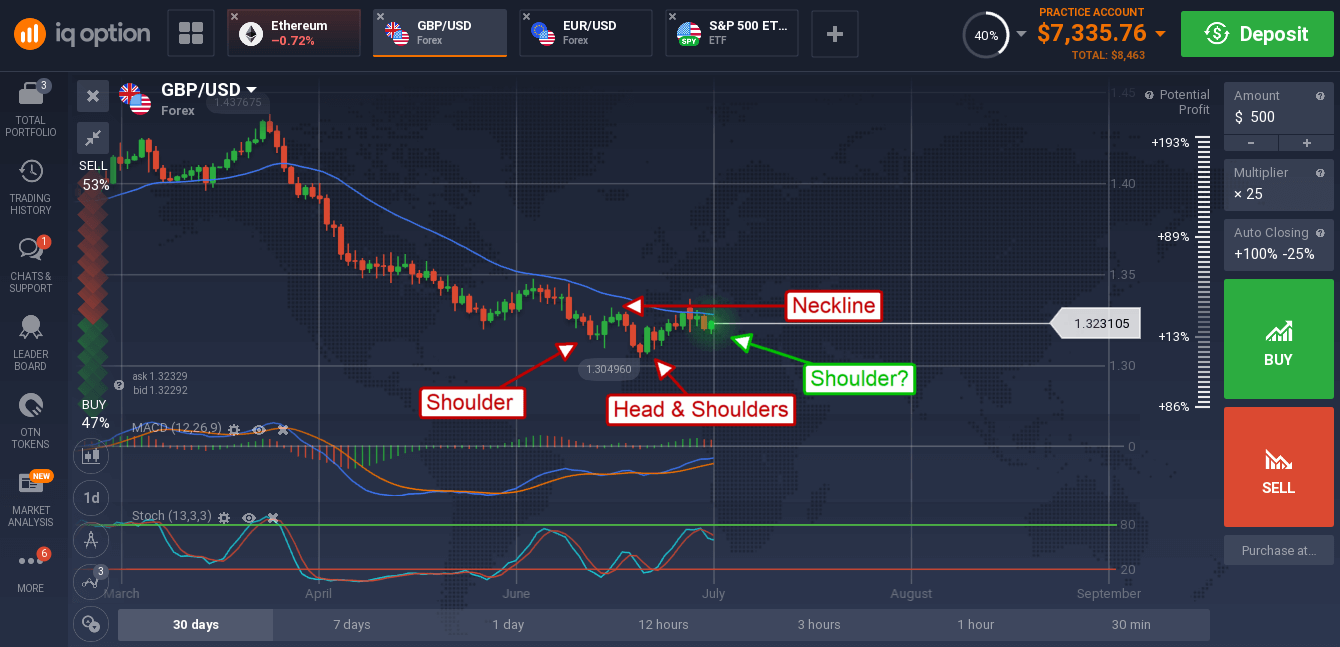
The indicators are mixed in their signals, consistent with a test of resistance (the pair is fighting resistance at the short term EMA) but showing some signs of bullishness too. The neckline is near 1.3315, a move above that would be bullish.
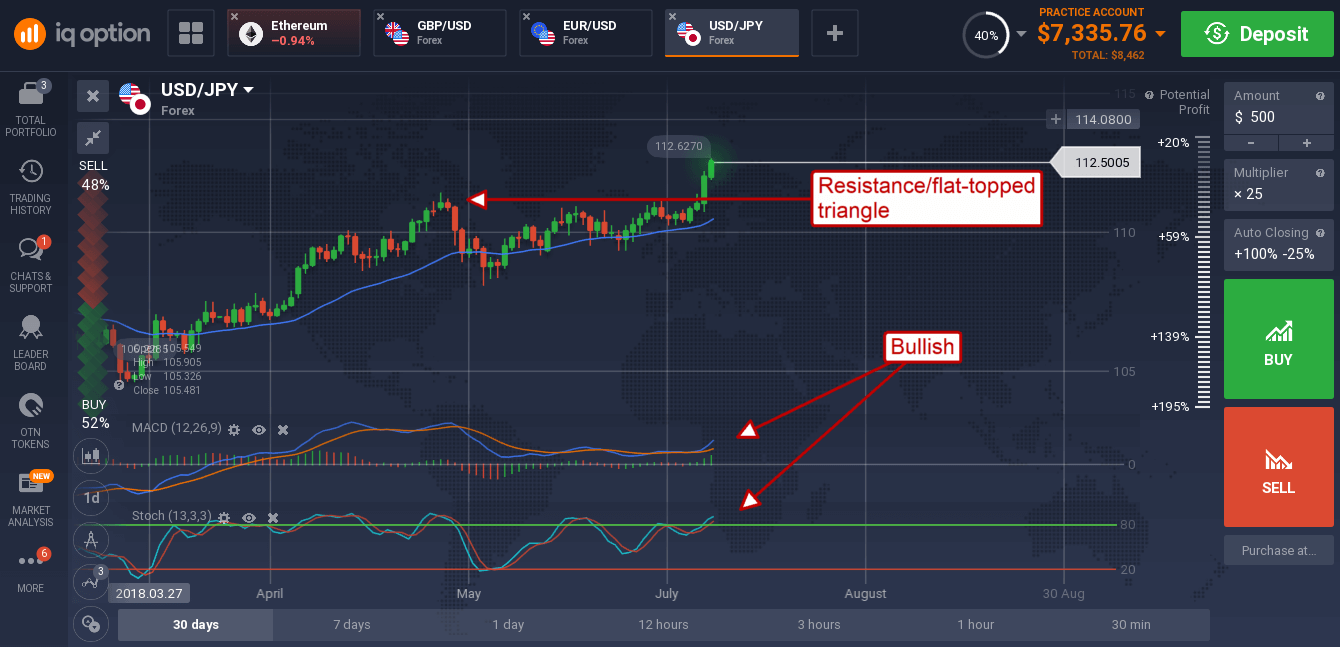
The dollar was able to make strong gains versus the yen as haven appeal fades. The USD/JPY created a medium sized green candle extending a rally that began earlier this week and looks like it will move higher. The indicators are bullish and confirm the move with a target of 113.25 in the near term.
