The previous trading week was not hiding surprises in macroeconomic announcements. Specifically, the US current account balance deficit was lower than was expected, because although USA runs big trade balance deficit and 3,5% fiscal balance deficit, the implemented tax cuts of this year helped in the repatriation of multinational companies’ capital from overseas and the boost of US private sector balance surplus. On the other hand, the building permits and existing home sales were worse than anticipated, confirming the six months’ downtrend in real estate market and the PMI composite and the PMI services index were lower than expected but higher than the 50 points level that distinguishes the manufacturing growth from the contraction. The peaking of the 2 previous indicators incurred 4 years ago.
For the next week, it is going to be announced in Tuesday the US consumer confidence of August which recorded the highest reading of the last 14 years the previous month, the new home sales of August in Wednesday which the last 8 months are in a declining trend, the second quarter’s US gross domestic product in Thursday, which peaked in August’s reading and in Friday the August’s US Michigan consumer confidence index, which is in an uptrend and the US core inflation rate of August that the last 3 months has met the target of Federal Reserve bank.
However, the most important macroeconomic event of the week is the conference and announcement of Federal Reserve bank for the raise of interest rates in Wednesday, which interest futures markets consider certain. But, the US yield curve in the previous interest rates raises flattened more than one would expect, revealing the problem of US economy, which is the low productivity and anemic wage growth .US Federal Reserve bank does not have other alternative from raising the interest rates, given that US economy achieved its dual goal of full employment and 2% core inflation rare. Lastly, because of the previous referred problems of US economy, the result will be the next 3 months the US yield curve to move towards inversion.

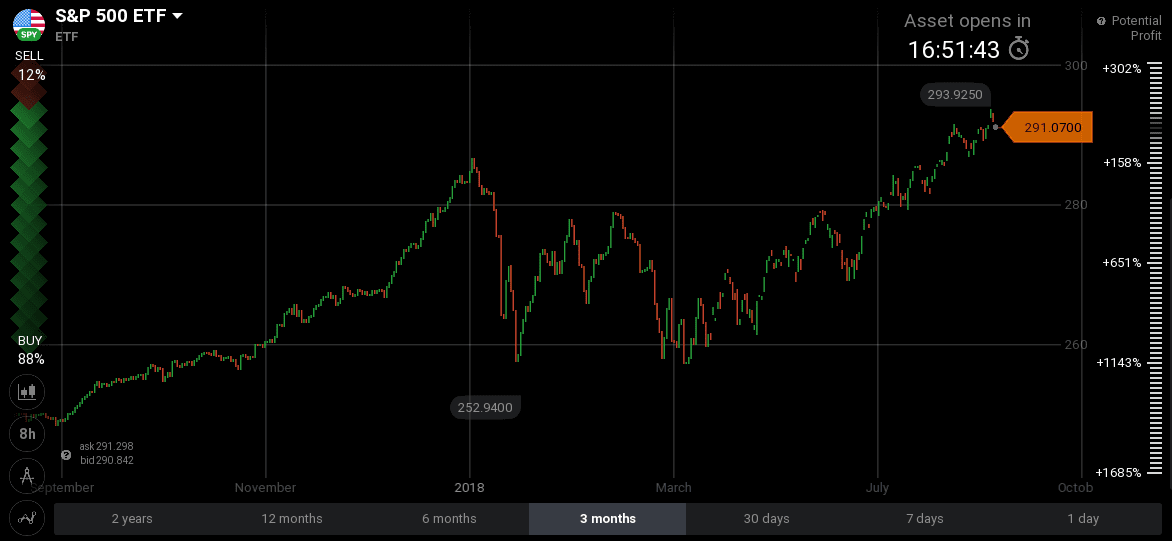
US bull market continues its unstoppable uptrend and the previous week the S&P 500 index recorded a new all- time high. The fair value of S&P 500 index given the expected forward earnings for 2018 is the 3000 points level and the most probable is that US stock market will approach it. But, we must not forget the midterm US elections of November’s 2018, where president Trump will announce a new round of tax cuts, which will overheat US economy. The result combined with the already implemented US tariffs in China and Europe will be higher inflation, lower growth rate and bigger fiscal imbalance which will lead US economy in stagflation, economic slowdown and subsequently a recession. In other words, the tax cuts gains will be absorbed from US tariffs domestic price hikes. However, as long as Faang stocks index does not enter in a bear market territory and growth stocks investing thrives, this bull market will continue its rising route.
On the other hand, according to long term econometric models in US stock market’s history, when 80% of S&P INDEX companies had beaten their earnings forecasts, then followed a big correction or worst a bear market. Also, the biggest current implemented shares repurchases’ program after 2008 from S&P 500 index companies deserves our attention, because these similarities combined with the plummeting firstly of all crypto currencies and after the fall year to date of US government bonds prices has justified in the half the intermarket analysis and remain firstly the stocks and after the commodities to fall for be confirmed the intermarket analysis theory.
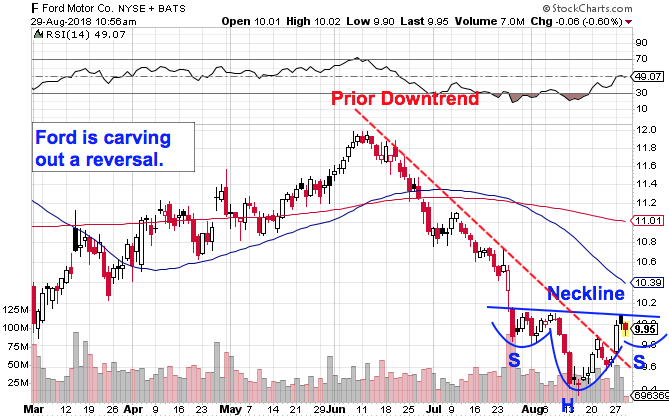
The three signs that will lead to a US stock bear market are the large cap stocks prices to fall before the small cap stocks prices, the US automakers and chemical stocks prices to enter in a bear market, because they have the highest degree of operating leverage and lastly US oil spot market’s price to break in the upside the level of 80 dollars , which will lead US economy in stagflation, higher discount rates for stocks and lower stock prices. Finally , these three referred signs will lead in a big narrowing the us equity premium in comparison to the US historical premium, with immediate consequence the fall of stocks globally.
The following stock chart of Ford reveals the truth:


