US economy this year is in an interesting uptrend, but the rest economies of the world do not perform so well. The US manufacturing index and US consumer confidence index reached an all-time high of the last 14 years, the US economy is in full employment, the last US gross domestic product growth rate exceeded the us long term potential gross domestic growth rate and the growth rate for the last 2nd quarter of 2018 was 4,2% year over year.
The following chart is very revealing:
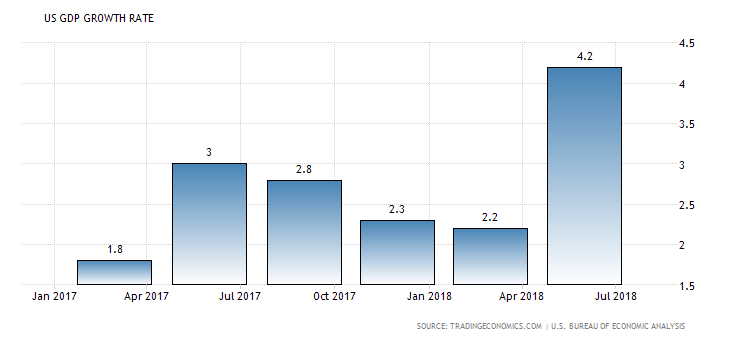
While all these economic indicators may indicate that US economy will continue to thrive , unfortunately these good numbers, which have peaked are associated with the end of this business cycle and given that Fed is going to raise the interest rates on 26th September of 2018,which will be the ninth increase of interest rates after the fall of interest rates at near 0% globally because of the big financial crisis and also that the manufacturing indicators of the most G20 countries are the last 3 months in a declining trend the bad omens are more than the good. If we add that the last three months the US inflation rate has risen at 2% year over year and has met the Fed’s target inflation rate of 2%, there is the danger US economy to be overheated and consequently to follow firstly an economic slowdown and after a recession.
In this also points the incident that the US yield curve is in its flattest shape from the December of 2007, before the big financial crisis of 2008.Finally a very negative factor for the performance of US economy is that the month of august the US trade balance deficit widened to its biggest level the last 3 years,which indicates that the US economy growth rate is going to be reduced and also the us current account balance deficit to be widened in the future if this trend continues
Fundamental analysis
It is a fact that the current bull market is the longest in the history of the US stock market and counts totally 9 and half years after the big financial crisis and the question remains the same. Is it going to last long time from now? The answer is that this bull market is missing one important factor that the other 2 longest bull markets shared. It is the high productivity, which causes high wage growth gains and high boost of consumer spending in US economy, which accounts for 75% of the US gross domestic product. However,,the other 3 factors that this bull market shares with the previous are low inflation, low interest rates and high corporate profitability.
But the omens for the continuation of this bull market are not so supportive. The factors that contribute negatively to this are the trade war of USA with the rest of the world,the fact that over of 90% annual gains of S&P 500 are owed to five stocks, also the fall of emerging markets and the correction of Europe Stoxx 50 index, the rally of dollar and the break of speculative carry trade,the fact that 80% of S&P 500 companies beat their earnings forecasts the second quarter of 2018, the highest shares repurchasing program that began in this September from S&P 500 companies the last 10.5 years, the confirmation of the intermarket analysis, which says that before an economic slowdown firstly turn down the bonds ,after the stocks and lastly the commodities,the outperformance of US small cap stocks and Russell 2000 index for the year , the outperformance of US utilities sector the last 2,5 months, which discounts an economic slowdown some months ago historically in US stock market and finally the incident that the era of quantitative easing is closely to its end.
On the other hand the factors that point to the continuation of the rally are the high expectations for us corporate profitability the third quarter and the historically low interest rates. So, we can say after this extensive analysis, that the most probable scenario for the US stock market is to fall from its current level in the mid and long term, but in the short term to be neutral or to approach the fair value for S&P 500 index for this year, which is the 3000 level. Finally, the following US Russell 2000 index chart is very revealing: